How to categorize data based on values in Excel?
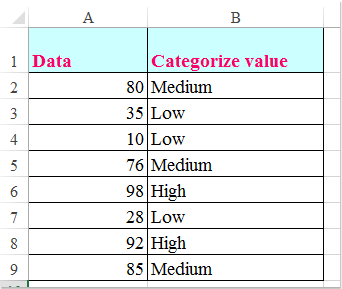
In many daily Excel data processing tasks, you may need to group or classify data values for easier analysis and reporting. For example, when managing exam scores, sales figures, or survey results, you might want to quickly assign categories such as High, Medium, and Low to values based on set thresholds. Suppose you have a dataset where you want any value greater than90 to be labeled as High, between60 and90 as Medium, and less than60 as Low, as illustrated in the screenshot below. This type of categorization makes it much easier to interpret large datasets and communicate trends or performance at a glance. How can you efficiently achieve this categorization in Excel?
Categorize data based on values with IF function
For straightforward classification based on a small number of rules, you can use the IF function to assign categories according to the value ranges you specify.
This method is ideal when your categorization rules are simple and the thresholds are fixed. Its biggest advantage is simplicity, but it can become unwieldy if there are too many categories or the logic becomes complex.
To categorize your data, follow these steps:
Step 1: Enter the following formula into a blank cell (e.g., B2, assuming your values start from A2):
=IF(A2>90,"High",IF(A2>60,"Medium","Low"))Step 2: Press Enter to confirm. Then drag the fill handle down to apply the formula to the rest of the data. Values will now be categorized as shown below:

Parameter explanation & tips:
- The formula checks the value in A2. If it's greater than 90, the result is "High". If not, it checks whether it's greater than 60; if so, "Medium" is returned. Otherwise, "Low" is assigned.
- You can adjust the thresholds and category labels (e.g., 90, 60) to fit your scenario.
- If your data starts from a different row, modify "A2" accordingly.
- Double-check greater than / less than signs to ensure correct categorization.
Common issues & troubleshooting:
- If the formula returns an error, check for extra spaces or incorrect cell references.
- If the output doesn't match expectations, ensure the nested IF logic order is correct.
Categorize data based on values with VLOOKUP function
When you need to handle more complex classification rules with multiple categories or want an easier way to adjust those rules, the VLOOKUP function provides a flexible alternative. This is especially useful if your categories or intervals change frequently or are maintained in a separate reference table.
In this method, a lookup table defines the value breakpoints and their corresponding category names. It allows you to easily add, remove, or update category logic without modifying individual formulas.

Step 1: Create a reference table (e.g., in cells F1:G6) with the left column listing the minimum values for each category, and the right column showing the corresponding category names.
Step 2: Enter the following formula into a blank cell, such as B2:
=VLOOKUP(A2,$F$1:$G$6,2,1)Step 3: Press Enter, then drag the fill handle to apply the formula to the rest of your data. Your values will be categorized accordingly:

Note: In the formula:
- A2 is your value cell.
- $F$1:$G$6 is the lookup table range.
- 2 refers to the column with category labels.
- 1 means approximate match. Make sure column F is sorted in ascending order.
Parameter explanation & tips:
- You can update the lookup table to reflect any changes in classification logic without editing the main formula.
- Ensure your lookup table is sorted by the minimum threshold value in ascending order.
- Suitable for handling many categories or complex segmentation scenarios.
Common issues & troubleshooting:
- If the formula returns
#N/A, check that the value exists within the range of your lookup table and that the table is sorted correctly. - If categories appear mismatched, verify that your breakpoints in the left column are logically ordered and appropriate for the data.
Categorize data visually using Conditional Formatting
Conditional Formatting in Excel allows you to visually distinguish data categories without adding explicit text labels. By applying color scales, data bars, or icon sets, you can easily highlight High, Medium, and Low values for quick interpretation. This method is ideal for dashboards, reports, and at-a-glance analysis where visual cues are more effective than text.
Typical use cases include:
- Presenting summarized insights during meetings or in reports.
- Highlighting outliers or spotting trends across a data range.
- Minimizing visual clutter by avoiding extra columns or text labels.
To apply Conditional Formatting to categorize your data:
- Select the data range (e.g., A2:A20).
- Click Home > Conditional Formatting.
- For color scales:
1)Choose Color Scales, and select a three-color scale representing Low, Medium, and High.
2)To adjust thresholds, go to Conditional Formatting > Manage Rules > Edit Rule. - For icon sets:
1)Choose Icon Sets (e.g., traffic lights, arrows).
2)Then use Manage Rules > Edit Rule to define thresholds, such as:
“Green” for values > 90, “Yellow” for values > 60, and “Red” for ≤ 60.
Tips and precautions:
- Conditional formatting doesn’t change the underlying data or structure—keeping your sheet clean.
- To clear or modify formatting, use Conditional Formatting > Clear Rules.
- You can reuse the same formatting using Format Painter.
- Feel free to customize color themes or icon sets based on your reporting needs.
Possible issues & troubleshooting:
- If incorrect icons or colors appear, double-check your rule thresholds.
- If the formatting is applied to the wrong range, clear the rules and reapply to the correct selection.
Advantages: Quick visual categorization without extra columns.
Disadvantages: No actual category text output—may not be ideal when further filtering, exporting, or calculations are needed.
Automate categorization with VBA code
For large datasets or highly customized classification requirements, using VBA (Visual Basic for Applications) code can automate the process of assigning categories or applying formatting based on value ranges. This approach is practical when you have repetitive tasks, want to standardize data processing, or need to quickly update or rerun categorization with different rules.
Typical use cases:
- Automatically categorize long lists without manual formula input.
- Apply custom logic or combine category assignment with other tasks (e.g., highlighting or exporting).
- Quickly reapply classification after data updates.
Note: Please save your workbook before running VBA code, as macros cannot be undone. Enable macros if prompted.
To use VBA for automatic categorization:
1. Click Developer > Visual Basic to open the Microsoft Visual Basic for Applications window. Then click Insert > Module and paste the following code into the module window:
Sub CategorizeValues()
    Dim rng As Range
    Dim cell As Range
    Dim categoryCol As Range

    On Error Resume Next
    xTitleId = "KutoolsforExcel"

    Set rng = Application.InputBox("Select data range (single column):", xTitleId, "", Type:=8)
    If rng Is Nothing Then Exit Sub

    Set categoryCol = rng.Offset(0, 1)

    For Each cell In rng
        If IsNumeric(cell.Value) Then
            Select Case cell.Value
                Case Is > 90
                    categoryCol.Cells(cell.Row - rng.Row + 1, 1).Value = "High"
                Case Is > 60
                    categoryCol.Cells(cell.Row - rng.Row + 1, 1).Value = "Medium"
                Case Else
                    categoryCol.Cells(cell.Row - rng.Row + 1, 1).Value = "Low"
            End Select
        Else
            categoryCol.Cells(cell.Row - rng.Row + 1, 1).Value = ""
        End If
    Next cell
End Sub
2. Click the ![]() Run button to execute. When prompted, select the column containing the values (e.g., scores). The macro will write the category result (High / Medium / Low) in the column immediately to the right.
Run button to execute. When prompted, select the column containing the values (e.g., scores). The macro will write the category result (High / Medium / Low) in the column immediately to the right.
Explanation & key points:
- Thresholds are set in the code: values > 90 → High, > 60 → Medium, else Low. You can customize these numbers.
- Non-numeric values are ignored and left blank.
- To output to a different column, modify
rng.Offset(0, 1)accordingly.
Error reminders & troubleshooting:
- If nothing happens, check your macro security settings and confirm macros are enabled.
- If you selected the wrong range, simply rerun the macro.
- Always work on a copy of your file if you are testing for the first time.
Advantages: Efficient for large datasets, customizable rules, reduces manual work.
Disadvantages: Requires enabling macros and basic VBA familiarity.

Unlock Excel Magic with Kutools AI
- Smart Execution: Perform cell operations, analyze data, and create charts—all driven by simple commands.
- Custom Formulas: Generate tailored formulas to streamline your workflows.
- VBA Coding: Write and implement VBA code effortlessly.
- Formula Interpretation: Understand complex formulas with ease.
- Text Translation: Break language barriers within your spreadsheets.
Best Office Productivity Tools
Supercharge Your Excel Skills with Kutools for Excel, and Experience Efficiency Like Never Before. Kutools for Excel Offers Over 300 Advanced Features to Boost Productivity and Save Time. Click Here to Get The Feature You Need The Most...
Office Tab Brings Tabbed interface to Office, and Make Your Work Much Easier
- Enable tabbed editing and reading in Word, Excel, PowerPoint, Publisher, Access, Visio and Project.
- Open and create multiple documents in new tabs of the same window, rather than in new windows.
- Increases your productivity by 50%, and reduces hundreds of mouse clicks for you every day!
All Kutools add-ins. One installer
Kutools for Office suite bundles add-ins for Excel, Word, Outlook & PowerPoint plus Office Tab Pro, which is ideal for teams working across Office apps.
- All-in-one suite — Excel, Word, Outlook & PowerPoint add-ins + Office Tab Pro
- One installer, one license — set up in minutes (MSI-ready)
- Works better together — streamlined productivity across Office apps
- 30-day full-featured trial — no registration, no credit card
- Best value — save vs buying individual add-in