How to do break-even analysis in Excel?
Break-even analysis can help you get the point when the net profit is zero, which means the total revenues equals to the total expenses. It is quite useful to price a new product when you can forecast your cost and sales.
- Do break-even analysis with Goal Seek feature
- Do break-even analysis with formula
- Do break-even analysis with chart
Do break-even analysis with Goal Seek feature
Supposing you are going to sale a new product, and you know the variable cost of per unit and the total fixed cost. Now you are going to forecast the possible sales volumes, and price the product based on them.
1. Make an easy table, and fill items with given data in the table. See below screenshot: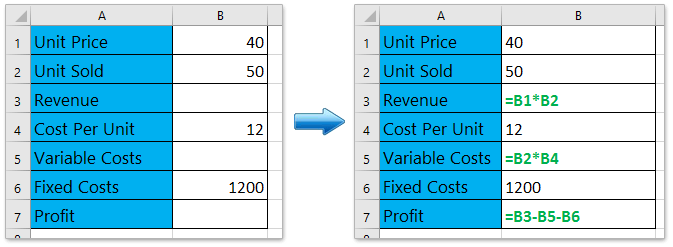
2. Enter proper formulas to calculate revenue, variable cost, and profit. See above screenshot:
Revenue = Unit Price x Unit Sold
Variable Costs = Cost per Unit x Unit Sold
Profit = Revenue – Variable Cost – Fixed Costs
3. Click the Data > What-If Analysis > Goal Seek.
4. In the opening Goal Seek dialog box, please do as follows (see above screenshot):
(1) Specify the Set Cell as the Profit cell, in our case it is Cell B7;
(2) Specify the To value as 0;
(3) Specify the By changing cell as the Unit Price cell, in our case it is Cell B1.
(4) Click OK button.
5. And then the Goal Seek Status dialog box pops up. Please click the OK button to apply it.
Now it changes the Unit Price from 40 to 31.579, and the net profit changes to 0. Therefore, if you forecast the sales volume is 50, and the Unit price cannot be less than 31.579, otherwise loss occurs.
Download complex Break-even Template
http://office.microsoft.com/en-us/templates/breakeven-analysis-TC001116512.aspx
http://office.microsoft.com/en-us/templates/break-even-analysis-TC001017515.aspx

Unlock Excel Magic with Kutools AI
- Smart Execution: Perform cell operations, analyze data, and create charts—all driven by simple commands.
- Custom Formulas: Generate tailored formulas to streamline your workflows.
- VBA Coding: Write and implement VBA code effortlessly.
- Formula Interpretation: Understand complex formulas with ease.
- Text Translation: Break language barriers within your spreadsheets.
Do break-even analysis with formula
Comparing to the Goal Seek feature, we can also apply the formula to do the break-even analysis easily in Excel.
1. Make an easy table, and fill items with given data in the table. In this method, we suppose the profit is 0, and we have forecasted the unit sold, the cost per unit, and fixed costs already. See below screenshot:
2. In the table, type the formula =B6/B2+B4 into Cell B1 for calculating the Unit Price, type the formula =B1*B2 into Cell B3 for calculating the revenue, and type the formula =B2*B4 into Cell B5 for variable costs. See below screenshot:
And then when you change andy one value of forecasted unit sold, cost per unit, or fixed costs, the value of unit price will change automatically. See above screenshot:
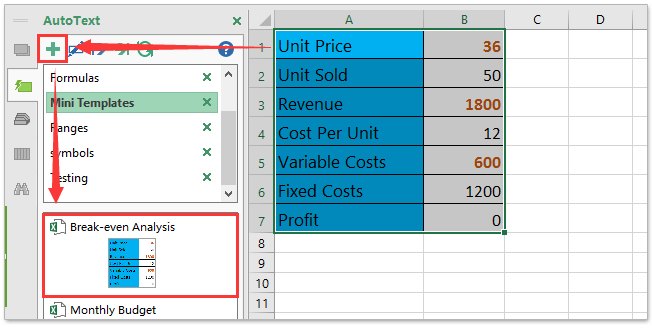
Tip: Save a range as AutoText entry (remaining cell formats and formulas) for reusing in future
It must be very tedious to refer cells and apply multiple formulas for the break-even analysis every time. Kutools for Excel provides a cute workaround of AutoText utility to to save the range as an AutoText entry, which can remain the cell formats and formulas in the range. And then you can reuse this range with just one click in any workbook.
Do break-even analysis with chart
If you have recorded the sales data already, you can also make the break-even analysis with chart in Excel. This method will guide you to create a break-even chart easily.
1. Prepare a sales table as below screenshot shown. In our case, we assume the sold units, cost per unit, and fixed costs are fixed, and we need to make the break-even analysis by unit price.
2. Finish the table as below shown:
(1) In the Cell E2, type the formula =D2*$B$1, and drag its AutoFill Handle down to Range E2:E13;
(2) In the Cell F2, type the formula =D2*$B$1+$B$3, and drag its AutoFill Handle down to Range F2:F13;
(3) In the Cell G2, type the formula =E2-F2, and drag its AutoFill Handle down to the Range G2:G13.
So far, we have finished the source data of break-even chart we will create later. See below screenshot:
3. In the table, please select the Revenue column, Costs column, and Profit column simultaneously, and then click Insert > Insert Line or Area Chart > Line. See screenshot:
4. Now a line chart is created. Please right click the chart, and select Select Data from the context menu. See below screenshot: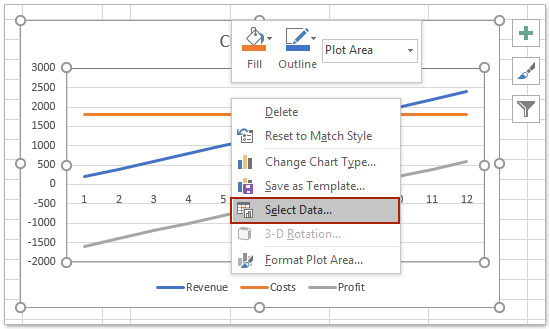
5. In the Select Data Source dialog box, please:
(1) In the Legend Entries (Series) section, select one of series as you need. In my example, I select the Revenue series;
(2) Click the Edit button in the Horizontal (Category) Axis Labels section;
(3) In the popping out Axis Labels dialog box, please specify the Unit Price column (except the column name) as axis label range;
(4) Click OK > OK to save the changes.
Now in the break-even chart, you will see the break-even point occurs when the price equals to 36 as below screenshot shown: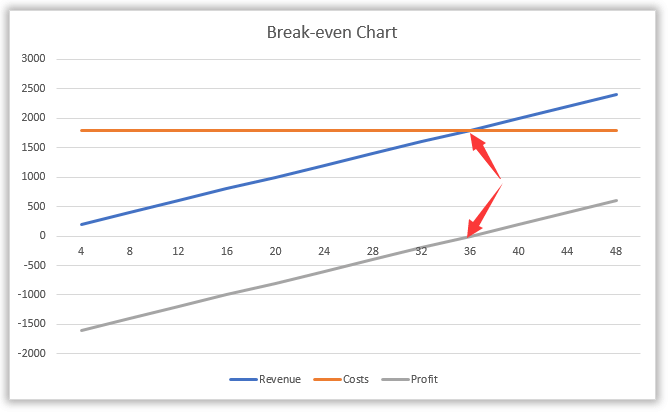
Similarly, you can also create a break-even chart to analyze the break-even point by sold units as below screenshot shown:
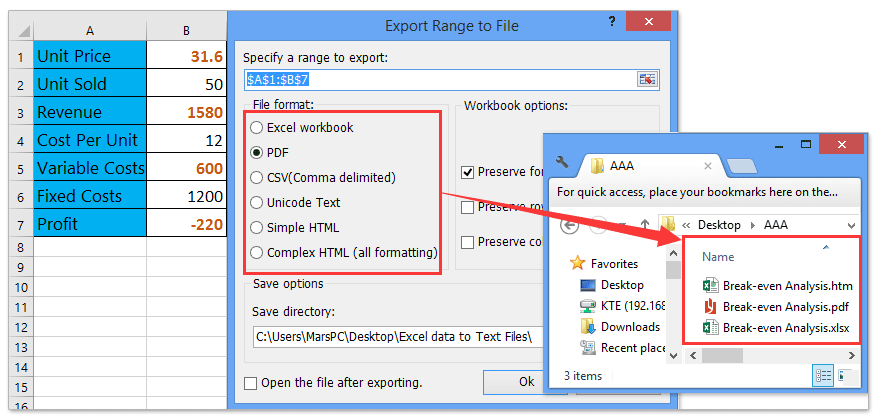
Easily export/save selection as separate PDF/CSV/TEXT/HTML files in Excel
For example, when you finish your break-even analysis in Excel, you may want to make your presentation with this break-even analysis. In this condition, you can apply Kutools for Excel’s Export Range To File utility to quickly export the selection as a separate PDF file, HTML file, CSV file, Text file, etc.
Best Office Productivity Tools
Supercharge Your Excel Skills with Kutools for Excel, and Experience Efficiency Like Never Before. Kutools for Excel Offers Over 300 Advanced Features to Boost Productivity and Save Time. Click Here to Get The Feature You Need The Most...
Office Tab Brings Tabbed interface to Office, and Make Your Work Much Easier
- Enable tabbed editing and reading in Word, Excel, PowerPoint, Publisher, Access, Visio and Project.
- Open and create multiple documents in new tabs of the same window, rather than in new windows.
- Increases your productivity by 50%, and reduces hundreds of mouse clicks for you every day!
All Kutools add-ins. One installer
Kutools for Office suite bundles add-ins for Excel, Word, Outlook & PowerPoint plus Office Tab Pro, which is ideal for teams working across Office apps.
- All-in-one suite — Excel, Word, Outlook & PowerPoint add-ins + Office Tab Pro
- One installer, one license — set up in minutes (MSI-ready)
- Works better together — streamlined productivity across Office apps
- 30-day full-featured trial — no registration, no credit card
- Best value — save vs buying individual add-in