Create a variable width column chart in Excel
Normally, a standard column chart displays all columns with the same width. You can only compare data by the column heights in a column chart in Excel. Is there any method to create a variable column chart so that the columns can vary in both width and height? This tutorial provides a step-by-step guide to help you create a variable width column chart in Excel.
Create a variable width column chart in Excel
Easily create a horizontal bullet chart with an amazing tool
Download the sample file
Create a variable width column chart in Excel
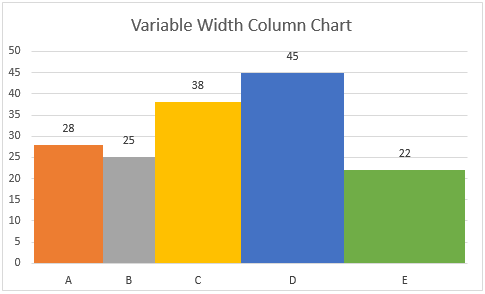
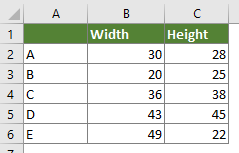
Supposing you want to create a variable width column chart based on data as the below screenshot shown, please do as follows to get it down.
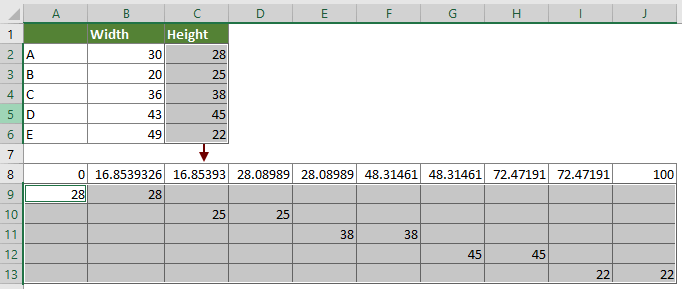
1. Firstly you need to calculate the position where each column ends on the X axis in the chart with the below formulas.
Note: Here we specify the minimum of the X-axis as 0 and the maximum as 100, so the column starts from 0 and ends with 100.


2. Now list each height values twice (based on the heights of the original data range) in different rows under the helper row you created just now.
3. Select the whole helper range (A8:J13 in this case), click Insert > Insert Line or Area Chart > Stacked Area.

4. Then a stacked area chart is created as the below screenshot shown. Select the bottom area (the series1 in the chart), and then press the Delete key to remove it from the chart.

5. Right click the X-axis and select Format Axis from the context menu.

6. In the opening Format Axis pane, select the Date axis option in the Axis Type section.

7. Go back to the chart, right click on it and choose Select Data in the right-clicking menu.

8. In the Select Data Source dialog box, click the Edit button in the Horizontal (Category) Axis Labels box,
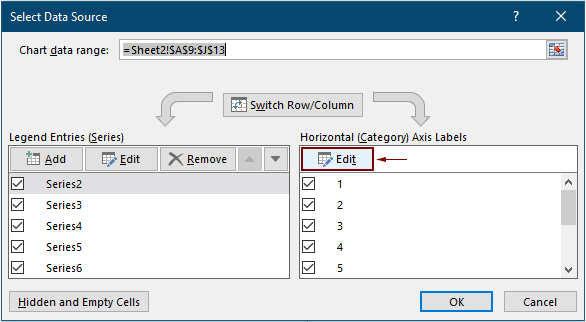
9. In the popping up Axis Labels dialog box, select the first helper row of values you have created in step 1, and then click OK.

10. When it returns to the Select Data Source dialog box, click OK to save the changes.
Now the chart is displayed as the below screenshot shown.

11. Select the X-axis and then press the Delete key to remove it from the chart.
Now you need to calculate the middle values for each column in order to add the series names and the series values separately on the bottom and top of each column as the below screenshot shown.

12. Start with a new row, enter the values (represent the position where each column ends on the X-axis) you have calculated in step1 separately into cells. See screenshot:
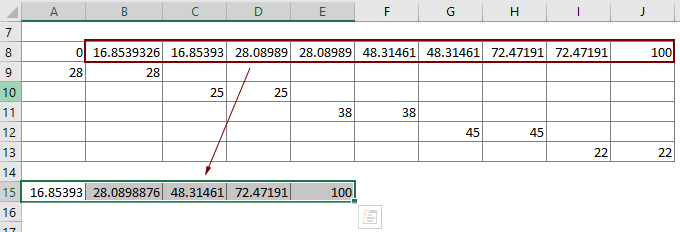
13. In the next row, enter the below formula into the first cell, and then press the Enter key.
=$A$15/2

14. Apply the below formula into the right blank cell, then drag its AutoFill Handle right to get the other results.
=(B15-A15)/2+A15

15. Enter the height values separately into cells in a new row. Besides, we still need a new row containing number 0 in cells.

16. Right click the chart and select Select Data in the right-clicking menu.
17. In the opening Select Data Source dialog box, click the Add button.
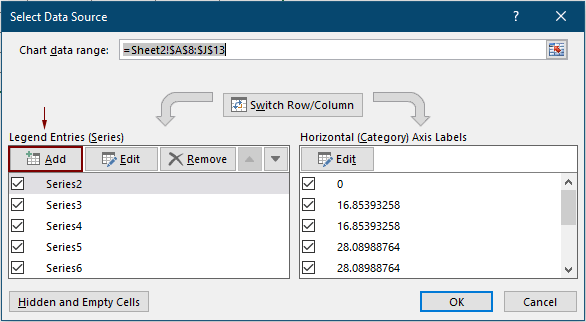
18. In the Edit Series dialog box, type in a name in the Series name box as you need, and in the Series values box, select the row cells containing the height values, then click the OK button.

19. When it returns to the Select Data Source dialog box, click the OK button to save the changes.
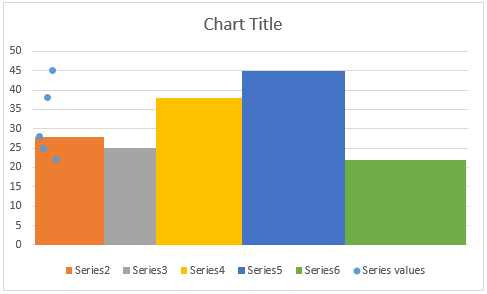
Now the chart is displayed as the below screenshot shown.

20. Right click on any series in the chart and select Change Series Chart Type from the right-clicking menu.

21. In the Change Chart Type dialog box, specify the chart type as Scatter for the new added series, and then click the OK button.

The chart is displayed as follows.
22. Right click the chart and click Select Data in the right-clicking menu.
23. In the Select Data Source dialog box, select the series you have added in step 18, and then click the Edit button.

24. In the opening Edit Series dialog box, select the cells that contain the middle values for each column, and then click the OK button.

25. Click OK in the Select Data Source dialog box to save the changes.
26. Select the dots, click the Chart Elements button, and then check the Data Labels box. See screenshot:

27. Now you need to hide all dots in the chart. Keep the dots selected, and then go to the Format Data Series pane to configure as follows.

28. Select the data labels you added just now, go to the Format Data Labels pane, and then choose the Above option in the Label Position section.

Now the series values are displayed centrally above each column as the above screenshot shown.
29. Right click the chart and select Select Data.
30. In the Select Data Source dialog box, click the Add button.
31. In the Edit Series dialog box, you need to:

32. When it returns to the Select Data Source dialog box, you can see a new series is added, click OK to save the changes.
33. Select the new series in the chart (the dots are hidden, you just need to click on the bottom center of any column to select them).

34. Click the Chart Elements button, and then check the Data Labels box.

35. Select the data labels, go to the Format Data Labels pane and configure as follows.
Tips: If the Format Data Labels pane does not display, please right click the data labels and select Format Data Labels from the right-clicking menu.


36. Now the chart is displayed as follows. Please remove the legend and modify the chart title.

Then a variable width column chart is complete.
Easily create a variable width column chart in Excel
The Variable Width Column Chart utility of Kutools for Excelcan help you quickly create a variable width column chart in Excel with several clicks only as the below demo shown.
Download and try it now! 30-day free trail
Download the sample file
The Best Office Productivity Tools
Kutools for Excel - Helps You To Stand Out From Crowd
Kutools for Excel Boasts Over 300 Features, Ensuring That What You Need is Just A Click Away...
Office Tab - Enable Tabbed Reading and Editing in Microsoft Office (include Excel)
- One second to switch between dozens of open documents!
- Reduce hundreds of mouse clicks for you every day, say goodbye to mouse hand.
- Increases your productivity by 50% when viewing and editing multiple documents.
- Brings Efficient Tabs to Office (include Excel), Just Like Chrome, Edge and Firefox.