
Excel QUARTILE function

The QUARTILE function calculates the quartile for a given set of data. It returns the same value as the QUARTILE.INC function.

QUARTILE function VS. QUARTILE.INC function:

Starting from Excel 2010, the QUARTILE function has been replaced by the QUARTILE.INC function. Although they can both be used to calculate the quartile of a data set, the QUARTILE.INC function is more recommended for future use, because the QUARTILE function may not be available in future versions of Excel.

Syntax

QUARTILE(array, quart)

Arguments

  • Array (required): The array or cell range for which you want the quartile value;
  • Quart (required): A number between 0 and 4 indicates which quartile value to return.
 Number  Quartile value
 0  Minimum value
 1  The 1st quartile (25th percentile)
 2  The 2nd quartile - median value (50th percentile)
 3  The 3rd quartile (75th percentile)
 4  The 4th quartile - maximum value (100th percentile)

Remarks

1. If “quart” is not an integer, it will be truncated;
2. The #NUM! error occurs when either of the following conditions is met;
-- “array” is empty;
-- “quart” < 0 or “quart” > 4.
3. The #VALUE! error occurs if “quart” is non-numeric;
4.If the requested quartile falls between two of the values in the “array”, Excel will interpolate between these values to calculate the quartile.

Return value

It returns a numeric value.

Example

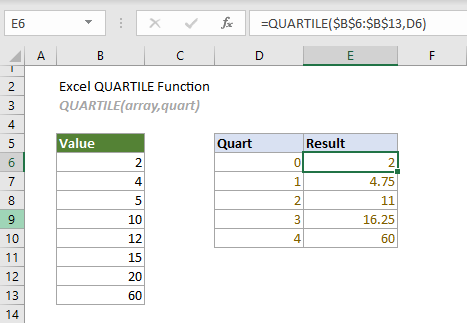
Here is a list of values as shown in the screenshot below, to calculate the minimum value, first quartile, second quartile, third quartile and maximum value by using the QUARTILE function, you can do as follows.

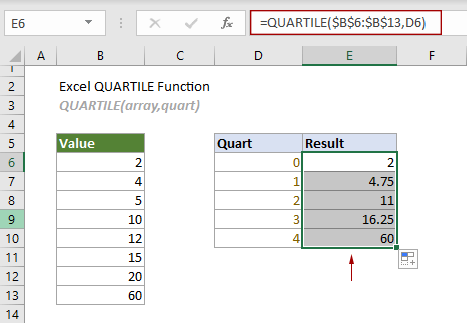
Select the top cell, E6 in this case, copy or enter the formula below and press Enter to get the result of the minimum value. Select this result cell and drag it AutoFill Handle down to get other quartiles.

=QUARTILE($B$6:$B$13,D6)

Notes:

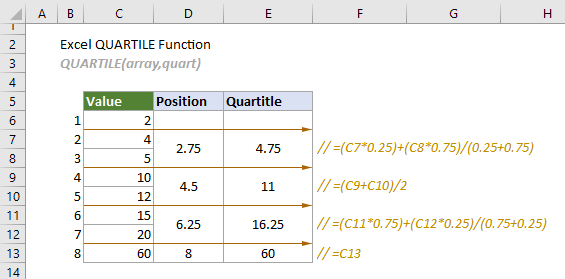
1) The formula in cell E6 can be changed to:

=QUARTILE({2,4,5,10,12,15,20,60},0)

2) The formula can be broken into the following two equations:

2.1 Firstly, apply the following equations to find the position of each quartile in the array:

(In the following equations, n is the total number of cells in the array.)

2.1.1 The equation for calculating the position of Q1:
= 1/4*(n-1)+1
In this case, the position of Q1 is 1/4*(8-1)+1 = 2.75, which means that the first quartile is located between the second and third digits of the array.
2.1.2 The equation for calculating the position of Q2:
= 2/4*(n-1)+1
In this case, the position of Q2 is 2/4*(8-1)+1 = 4.5, which means that the second quartile is located between the fourth and fifth digits of the array.
2.1.3 The equation for calculating the position of Q3:
= 3/4*(n-1)+1
In this case, the position of Q3 is 1/4*(8-1)+1 = 6.25, which means that the third quartile is located between the sixth and seventh digits of the array.
2.1.4 The equation for calculating the position of Q4:
= 4/4*(n-1)+1
In this case, the position of Q4 is 1/4*(8-1)+1 = 8, which means that the fourth quartile is located exactly in the eighth cell of the array.

2.2 Then, return the quartiles based on the positions.

2.2.1 As the position of Q1 (2.75) is closer to the third digit, the second digit is weighted 25% and the third digit is weighted 75%. Then you can apply the following formula to return the first quartile:
=(C7*0.25)+(C8*0.75)/(0.25+0.75) // result is 4.75
2.2.2 Q2 is at position 4.5 of the array, which happens to be the average of the 4th and 5th digits:
=(C9+C10)/2 // result is 11
2.2.3 As the position of Q3 (6.25) is closer to the sixth digit, the sixth digit is weighted 75% and the seventh digit is weighted 25%. Then you can apply the following formula to return the first quartile:
=(C11*0.75)+(C12*0.25)/(0.75+0.25) // result is 16.25
2.2.4 Q4 is exactly at the eighth position of the array, so it will be equal to the value of the cell in this position:
=C13 // result is 60
See the following screenshot:

Related Functions

Excel QUARTILE.EXC function
The QUARTILE.EXC function returns the quartile for a given set of data based on a percentile range of 0 to 1 exclusive.

Excel QUARTILE.INC function
The QUARTILE.INC function returns the quartile for a given set of data based on a percentile range of 0 to 1 inclusive.

Excel RANK function
The RANK function returns the rank of a number compared to other numbers in the same list.

Excel RANK.AVG function
The RANK.AVG function returns the rank of a number compared to other numbers in the same list.

Excel RANK.EQ function
The RANK.EQ function returns the rank of a number compared to other numbers in the same list.


The Best Office Productivity Tools

Kutools for Excel - Helps You To Stand Out From Crowd

🤖 Kutools AI Aide: Revolutionize data analysis based on: Intelligent Execution   |  Generate Code  |  Create Custom Formulas  |  Analyze Data and Generate Charts  |  Invoke Kutools Functions
Popular Features: Find, Highlight or Identify Duplicates  |  Delete Blank Rows  |  Combine Columns or Cells without Losing Data  |  Round without Formula ...
Super VLookup: Multiple Criteria  |  Multiple Value  |  Across Multi-Sheets  |  Fuzzy Lookup...
Adv. Drop-down List: Easy Drop Down List  |  Dependent Drop Down List  |  Multi-select Drop Down List...
Column Manager: Add a Specific Number of Columns  |  Move Columns  |  Toggle Visibility Status of Hidden Columns  Compare Columns to Select Same & Different Cells ...
Featured Features: Grid Focus  |  Design View  |  Big Formula Bar  |  Workbook & Sheet Manager | Resource Library (Auto Text)  |  Date Picker  |  Combine Worksheets  |  Encrypt/Decrypt Cells  |  Send Emails by List  |  Super Filter  |  Special Filter (filter bold/italic/strikethrough...) ...
Top 15 Toolsets12 Text Tools (Add Text, Remove Characters ...)  |  50+ Chart Types (Gantt Chart ...)  |  40+ Practical Formulas (Calculate age based on birthday ...)  |  19 Insertion Tools (Insert QR Code, Insert Picture from Path ...)  |  12 Conversion Tools (Numbers to Words, Currency Conversion ...)  |  7 Merge & Split Tools (Advanced Combine Rows, Split Excel Cells ...)  |  ... and more

Kutools for Excel Boasts Over 300 Features, Ensuring That What You Need is Just A Click Away...

Description


Office Tab - Enable Tabbed Reading and Editing in Microsoft Office (include Excel)

  • One second to switch between dozens of open documents!
  • Reduce hundreds of mouse clicks for you every day, say goodbye to mouse hand.
  • Increases your productivity by 50% when viewing and editing multiple documents.
  • Brings Efficient Tabs to Office (include Excel), Just Like Chrome, Edge and Firefox.
Comments (0)
No ratings yet. Be the first to rate!
There are no comments posted here yet
Please leave your comments in English
Posting as Guest
×
Rate this post:
0   Characters
Suggested Locations