How to display multiple charts in one chart sheet?
Imagine you have created several charts across different worksheets in your Excel workbook, and now you wish to compare or print them together. It can be inconvenient to flip between multiple worksheets just to review related visual data. To make the comparison easier and consolidate your presentation, it is often useful to gather all related charts into a single chart sheet. This approach not only streamlines your workflow but also allows for a neater and more organized printout or presentation. In this article, you will discover a practical method to efficiently display multiple charts on one chart sheet.
 Move and display multiple charts in one chart sheet
You can manually move and display multiple charts into a single chart sheet by following these detailed steps. This method is suitable when you have a moderate number of charts—such as preparing comparison dashboards, compiling end-of-report graphs for printing, or creating a handout with multiple visualizations. While the process is straightforward, it can become repetitive if you are combining a large number of charts.
1. Begin by creating a dedicated chart sheet if you haven’t already. To do this, right-click any worksheet tab at the bottom of your workbook, select Insert, then choose Chart and click OK. You can also move or rename this sheet as needed for better organization.
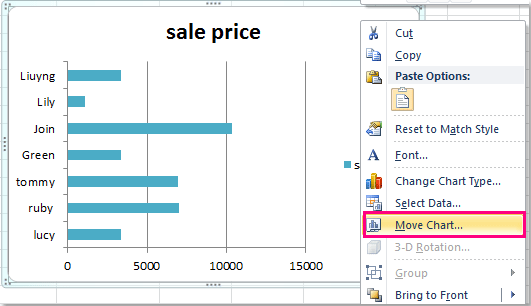
2. Go to the first worksheet containing a chart you’d like to move. Click to select the chart you want to transfer. Right-click the chart to open the context menu, then choose Move Chart. Refer to the following screenshot:
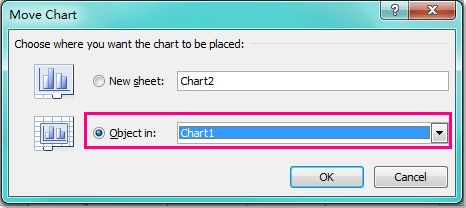
3. In the Move Chart dialog box that appears, select the Object in option. From the drop-down list, select the destination chart sheet you just prepared. This tells Excel where to place your selected chart. See the example below:
4. Click OK to confirm and close the dialog. Your selected chart will now be displayed in the chosen chart sheet.
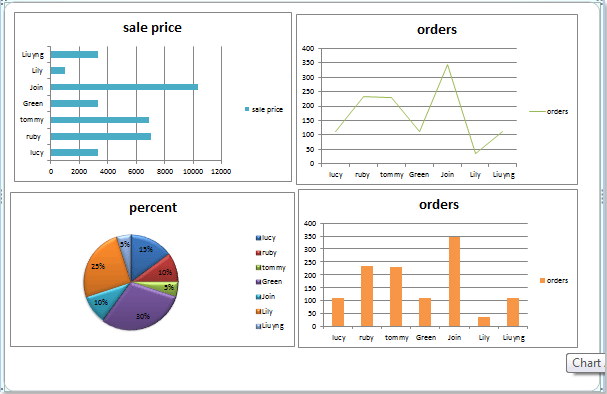
5. To combine more charts, repeat steps 2 through 4 for each additional chart. This process can be repeated for as many charts as needed—whether it be two, three, or more charts spread throughout your workbook. Once complete, all the selected charts will appear together on your designated chart sheet for easier comparison and collective editing. You can then manually adjust the position and size of the charts to make the layout more organized and visually appealing. See screenshot:
Tips and precautions: When moving charts, ensure you select the correct chart sheet each time in the 'Move Chart' dialog. The layout of charts on the target sheet might overlap after moving them; you can fix this by clicking and dragging them to rearrange as needed. If you need to move a large number of charts, or if they are spread across many worksheets, this process may be time-consuming and there is a risk of accidentally moving the wrong chart. For mass operations, an automated method may offer greater efficiency.
Troubleshooting: If after moving a chart it disappears from its original location but does not appear in the target sheet, double-check that you selected the correct chart sheet as the destination. Additionally, ensure the chart was selected (not just a cell) before right-clicking and choosing Move Chart.
Best Office Productivity Tools
Supercharge Your Excel Skills with Kutools for Excel, and Experience Efficiency Like Never Before. Kutools for Excel Offers Over 300 Advanced Features to Boost Productivity and Save Time. Click Here to Get The Feature You Need The Most...
Office Tab Brings Tabbed interface to Office, and Make Your Work Much Easier
- Enable tabbed editing and reading in Word, Excel, PowerPoint, Publisher, Access, Visio and Project.
- Open and create multiple documents in new tabs of the same window, rather than in new windows.
- Increases your productivity by 50%, and reduces hundreds of mouse clicks for you every day!
All Kutools add-ins. One installer
Kutools for Office suite bundles add-ins for Excel, Word, Outlook & PowerPoint plus Office Tab Pro, which is ideal for teams working across Office apps.
- All-in-one suite — Excel, Word, Outlook & PowerPoint add-ins + Office Tab Pro
- One installer, one license — set up in minutes (MSI-ready)
- Works better together — streamlined productivity across Office apps
- 30-day full-featured trial — no registration, no credit card
- Best value — save vs buying individual add-in