How to sort chart by value in Excel?
In daily work with Excel, we can easily sort our worksheet data based on values or custom criteria. However, when dealing with visual representations, such as charts, you may find that the actual order of chart series can affect readability and impact. Sorting a chart by value can help make your data story clearer, highlight top performers, or reveal trends more effectively. In this tutorial, we'll explore several practical methods for sorting chart data by value in Excel and discuss when each approach may be most useful.
Pivot Table Solution: Sort chart with Pivot Table
Sort chart by value
Because the chart series order will change automatically when you adjust the order of the original source data, a straightforward way to sort your chart by value is to sort the underlying data table. This method is both quick and reliable, and it works well for most scenarios where you want the chart to reflect the sorted data order.
Applicable scenarios: Sort your chart to highlight highest or lowest values, rank categories, or present sorted trends visually. Works with most chart types linked directly to worksheet data.
Advantages: No advanced skills required, changes update automatically in the chart as you sort the data. This method is ideal for charts whose data source can be freely rearranged.
Limitations: All sorting affects your actual worksheet data order, which may not be desirable in cases where the original order of data has specific meaning.
1. Select the original data value you want to sort by. For best results, select the complete data range that feeds your chart, including both categories and series. See screenshot:

2. Go to the Data tab, and in the Sort & Filter group, choose your preferred sort order such as Sort Largest to Smallest or Sort Smallest to Largest. See screenshot:

3. In the dialog box that appears, ensure the Expand the selection option is selected. This setting is important, as it expands your sort action to include all related columns or rows, keeping chart data properly aligned. Click Sort to apply.

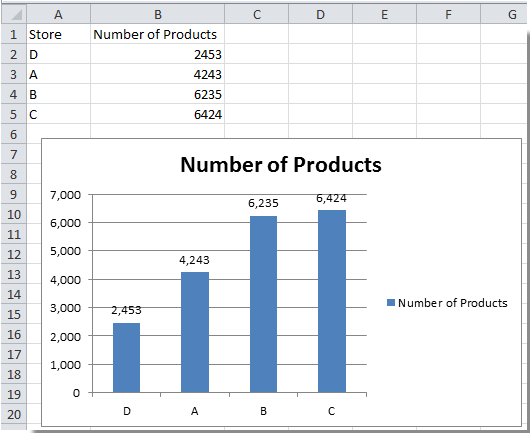
Now you will see the data table has been sorted, and your chart automatically updates to follow the new data order.
If you need to restore the original order, use Undo (Ctrl+Z) or sort by your initial category.
Summary recommendation: This method is ideal for most users who want a quick and direct solution for chart sorting, especially in clean and simple datasets.
Pivot Table Solution: Sort chart with Pivot Table
Using a pivot table, you can dynamically sort and filter data for your charts without adjusting the original source order. Pivot tables are ideal for large, complex datasets, allowing interactive analysis and chart updates as you manipulate the pivot's sort and filter settings.
Applicable scenarios: Reports where data exploration, multi-level sorting, or interactive filtering for charts is required.
Advantages: Keeps original data untouched, supports advanced sorting and grouping, and enables flexible chart updates with simple drag and drop.
1. Select your data range, then go to Insert > Pivot Table. In the dialog, choose where you want the pivot table placed.
2. In the Pivot Table Field List, drag the fields you want to analyze to the Row Labels and Values area. Your data will appear summarized.
3. Click the arrow beside your row label in the pivot table, select Sort Largest to Smallest (or another sort order as needed). The pivot table will update to reflect the selected sort.
4. Create your chart from the pivot table data (e.g., highlight pivot data and insert a column or bar chart). The chart will reflect the dynamically sorted values from the pivot table.
Tips: Refresh your chart as you update pivot filters or sort options. You can quickly reset the sort or regroup your data for different analysis perspectives.
Best Office Productivity Tools
Supercharge Your Excel Skills with Kutools for Excel, and Experience Efficiency Like Never Before. Kutools for Excel Offers Over 300 Advanced Features to Boost Productivity and Save Time. Click Here to Get The Feature You Need The Most...
Office Tab Brings Tabbed interface to Office, and Make Your Work Much Easier
- Enable tabbed editing and reading in Word, Excel, PowerPoint, Publisher, Access, Visio and Project.
- Open and create multiple documents in new tabs of the same window, rather than in new windows.
- Increases your productivity by 50%, and reduces hundreds of mouse clicks for you every day!
All Kutools add-ins. One installer
Kutools for Office suite bundles add-ins for Excel, Word, Outlook & PowerPoint plus Office Tab Pro, which is ideal for teams working across Office apps.
- All-in-one suite — Excel, Word, Outlook & PowerPoint add-ins + Office Tab Pro
- One installer, one license — set up in minutes (MSI-ready)
- Works better together — streamlined productivity across Office apps
- 30-day full-featured trial — no registration, no credit card
- Best value — save vs buying individual add-in