How to format data table numbers in chart in Excel?
Adding a data table to an Excel chart provides a clear, visual summary of the underlying values, which helps when you need to compare trends or present information at a glance. However, you may find that the default formatting of the numbers in the chart’s data table doesn’t match your reporting requirements or company standards. For example, you might wish to display large numbers with thousand separators and two decimal places for improved readability. Unfortunately, Excel currently does not offer a direct, built-in function to format the numbers within a chart's data table independently from the original worksheet data. This limitation can be inconvenient—particularly when presenting charts to colleagues or clients who expect consistent or more legible number formatting.
➤ Format chart data table using helper column
➤ Use VBA to update chart data table formatting
Format data table numbers in chart
Applicable Scenarios: This solution is suitable when your chart references worksheet data that you are able and willing to reformat. If the chart's underlying data is used elsewhere or must remain unaltered, you may want to consider creating a formatted helper range, which is covered in alternative solutions at the end of this guide. This method is ideal for routine data presentations, financial summaries, or any situation where standardizing numerical display in charts is important.
Advantages: This method instantly updates both the original data and the chart’s data table so their appearance is in sync. It is also straightforward and does not require complex steps or the use of macros.
Disadvantages: Changing the original data’s number format will also affect its display wherever it is used, which might not be suitable for all scenarios—especially if different worksheets or formulas rely on other specific formats.
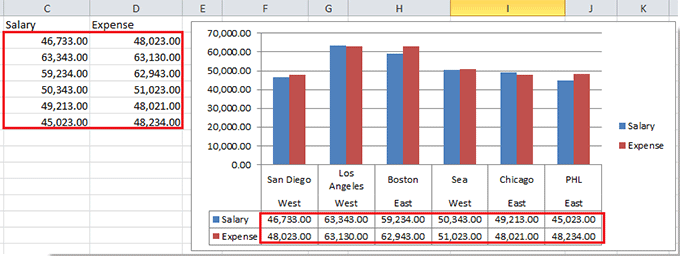
Suppose you have created a chart with a data table displayed beneath it, as illustrated below:

If your goal is to show the numbers in the chart’s data table using a format such as 46,733.00 (with commas as thousands separators and two decimal places), you’ll notice that there is no direct way to format these numbers from the chart itself. However, you can achieve the desired effect by applying the format directly to your source data in the worksheet. As soon as you change the number formatting in the cells where your chart pulls its data, the chart’s data table will instantly reflect these changes.
The following steps explain how to do this:
1. Select the range of original data cells that your chart uses. This is the data that appears in both your chart and the chart’s data table. Next, right-click anywhere inside your selected data range and choose Format Cells from the context menu. (If you have difficulty finding this option, make sure you are right-clicking on the cell content itself, not in the formula bar.) See the screenshot below:

2. In the Format Cells dialog box that appears, switch to the Number tab, then click Number in the Category list. In the options on the right, set the Decimal places box to 2 so numbers will consistently show two decimal digits. Also, check the Use1000 Separator (,) box to include commas for thousands. The sample area lets you preview how your formatting will look. This step ensures your chart’s data table will automatically use the format you specify here.
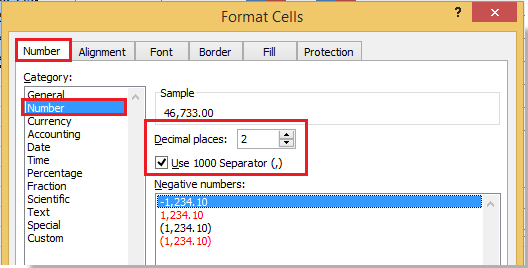
3. Click OK to confirm your settings and close the dialog box. Notice that both the original worksheet data and the numbers in the chart’s data table now reflect the formatting you applied. This update occurs instantly, as shown below:
Tip: If part of your original data is used elsewhere in different formats, consider creating a copy or helper range specifically for your chart and formatting that as needed. Remember, deleting or modifying this data can break the chart’s link and cause errors in the displayed information.
If you find that your number formatting does not immediately update in the chart’s data table, double-check that your chart references the correct range. Sometimes, indirect references or complex formulas may not instantly show the updated formatting.
Format chart data table using helper column
This approach is useful when you want one number format in the chart’s data table without changing the original data elsewhere.
1. Copy the source data into a helper range (same layout as the original).
2. (Recommended) Link the helper cells to the original with simple formulas (e.g., =B2) so updates flow automatically.
3. Select the helper range, right-click > Format Cells, and set the desired number format for how you want values to appear in the chart’s data table.
4. Insert your chart and set its data source to the formatted helper range.
5. If needed, enable the chart data table (Chart Design > Add Chart Element > Data Table) and verify the numbers show with the helper’s formatting.
Use VBA to update chart data table formatting
If you need flexible, repeatable formatting across one or many charts, a short VBA macro can reapply number formats to the worksheet source data. Charts that use those cells will reflect the new format in their Data Table.
1. Go to Developer > Visual Basic. In the VB editor, click Insert > Module, then paste this code:
Sub FormatChartSourceData()
    Dim ws As Worksheet
    Dim rng As Range
    On Error Resume Next
    xTitleId = "KutoolsforExcel"
    Set ws = Application.ActiveSheet
    Set rng = Application.InputBox("Select source data range for chart", xTitleId, ws.UsedRange.Address, Type:=8)
    If rng Is Nothing Then Exit Sub
    rng.NumberFormat = "#,##0.00"
End Sub
2. Click the ![]() Run button to execute. When prompted, select the exact source range used by your chart. The macro applies the chosen number format (default:
Run button to execute. When prompted, select the exact source range used by your chart. The macro applies the chosen number format (default: #,##0.00). Any chart using that range will show the updated format in its Data Table.
- Direct formatting of the Data Table is limited: Excel relies on the source cells’ number format. Format the source, not the Data Table itself.
- Use number formats, not TEXT(): Converting numbers to text (e.g., via
TEXT()) can break charting behavior. - Be precise with the selected range: Select only the cells the chart uses; avoid formatting unintended areas.
Summary: You cannot directly set number formats on the chart’s Data Table, but formatting the worksheet source range—manually or via this macro—reliably controls how numbers appear in that table.
Best Office Productivity Tools
Supercharge Your Excel Skills with Kutools for Excel, and Experience Efficiency Like Never Before. Kutools for Excel Offers Over 300 Advanced Features to Boost Productivity and Save Time. Click Here to Get The Feature You Need The Most...
Office Tab Brings Tabbed interface to Office, and Make Your Work Much Easier
- Enable tabbed editing and reading in Word, Excel, PowerPoint, Publisher, Access, Visio and Project.
- Open and create multiple documents in new tabs of the same window, rather than in new windows.
- Increases your productivity by 50%, and reduces hundreds of mouse clicks for you every day!
All Kutools add-ins. One installer
Kutools for Office suite bundles add-ins for Excel, Word, Outlook & PowerPoint plus Office Tab Pro, which is ideal for teams working across Office apps.
- All-in-one suite — Excel, Word, Outlook & PowerPoint add-ins + Office Tab Pro
- One installer, one license — set up in minutes (MSI-ready)
- Works better together — streamlined productivity across Office apps
- 30-day full-featured trial — no registration, no credit card
- Best value — save vs buying individual add-in