How to average based on day of week in Excel?
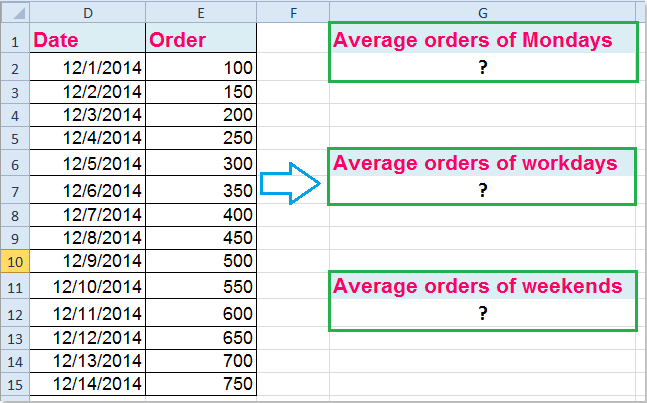
In Excel, you may often encounter scenarios where you need to calculate the average value for a list of numbers according to the day of the week associated with each entry. For example, you might want to analyze sales data to find the average number of orders on Mondays, workdays, or weekends. This requirement is common in sales reporting, performance tracking, or any situation involving time-based analysis. Below, you will find multiple practical solutions for averaging numbers by day of the week using formulas, VBA code, and Pivot Tables. These solutions help you obtain insights and better understand your data distribution according to calendar patterns.
↳ Specific weekday (e.g., Monday)
↳ Workdays (Mon–Fri)
↳ Weekends (Sat–Sun)
➤ Automate averaging by day of week with VBA Macro
➤ Pivot Table: Group and average by weekday without formulas
Calculate the average based on day of week with formulas
Calculate the average based on a specific day of week
To calculate the average of values tied to a particular day of the week, such as all Mondays, you can use Excel's array formulas or SUMPRODUCT. This is especially useful for summarizing daily trends and reviewing event patterns. For example, if you need to calculate the average orders specifically for Mondays in your dataset, use the following method:
Enter the following formula in a blank cell:
=AVERAGE(IF(WEEKDAY(D2:D15)=2,E2:E15))Then, press Ctrl + Shift + Enter simultaneously. This signals that the formula is an array formula and allows Excel to process each row individually, producing the correct result.

Notes and explanation:
- D2:D15 is your list of dates. Make sure these are valid Excel date values.
- 2 stands for Monday. The numbers for days of the week are: Sunday=1, Monday=2, Tuesday=3, Wednesday=4, Thursday=5, Friday=6, Saturday=7.
- E2:E15 is the range of numbers you want to average, such as order counts, sales, or similar metrics.
Tips:
- If your version of Excel supports dynamic array formulas (Office365 or later), you can directly enter the formula without using Ctrl + Shift + Enter.
- Check for empty or non-date cells to avoid formula errors.
As an alternative and more flexible approach, you can use SUMPRODUCT to achieve the same result. This method does not require array formula entry and is ideal for larger datasets:
=SUMPRODUCT((WEEKDAY(D2:D15,2)=1)*E2:E15)/SUMPRODUCT((WEEKDAY(D2:D15,2)=1)*1)After entering this formula in a cell, press Enter. Here, D2:D15 is your date range, E2:E15 is your data range, and 1 represents Monday (when using WEEKDAY's 2nd argument as 2, which makes Monday=1, Tuesday=2, ..., Sunday=7).
Calculate the average based on workdays
To calculate the average value for workdays (Monday to Friday) in your data, you can use the following array formula:
=AVERAGE(IF(WEEKDAY(D2:D15,2)={1,2,3,4,5},E2:E15))Enter this formula in an empty cell, then press Ctrl + Shift + Enter to confirm.

Notes and explanation:
- This computes the average only for rows where the date falls on a workday, i.e., Monday through Friday.
- Make sure your date values in D2:D15 are valid, otherwise WEEKDAY may not return expected results.
Tips:
- If you prefer to avoid array entry, use the SUMPRODUCT alternative below.
- Verify that the date column contains real Excel dates (not text).
Another way to achieve this is using a SUMPRODUCT formula:
=SUMPRODUCT((WEEKDAY(D2:D15,2)<6)*E2:E15)/SUMPRODUCT((WEEKDAY(D2:D15,2)<6)*1)Simply type this formula and press Enter. It will average values where the weekday number is less than 6, i.e., Monday to Friday.
Calculate the average based on weekends
For averaging only weekend values (Saturday and Sunday), use the following array formula:
=AVERAGE(IF(WEEKDAY(D2:D15,2)={6,7},E2:E15))Enter in an empty cell and confirm with Ctrl + Shift + Enter.

Notes and explanation:
- This formula targets dates where WEEKDAY returns 6 or 7 (Saturday or Sunday) when the second argument is 2.
Tips:
- For large datasets, the SUMPRODUCT alternative below can be faster and avoids array entry.
- Confirm that blank rows or non-dates are handled to prevent unexpected averages.
A quicker option with SUMPRODUCT, which works without array entry:
=SUMPRODUCT((WEEKDAY(D2:D15,2)>5)*E2:E15)/SUMPRODUCT((WEEKDAY(D2:D15,2)>5)*1)As always, verify the date values and check for blanks to ensure your results are accurate.
VBA Code - Automate averaging by day of week with a macro
For users who want a fully automated approach and have large datasets or require frequent updates, you can use VBA to loop through your data, group entries by weekday, and calculate averages for each day. This method is ideal if you want to bypass manual formula adjustment and quickly generate a weekday summary.
Advantages: Eliminates manual steps, produces a complete summary, and can be customized for further processing.
Disadvantages: Requires enabling macros and basic familiarity with VBA; may not be suitable for highly dynamic or cloud-based sheets.
Operation:
1. Click Developer Tools > Visual Basic to open the VBA editor. In the window, choose Insert > Module, then paste the following code into the new Module:
Sub AverageOrdersByWeekday()
    Dim dict As Object
    Set dict = CreateObject("Scripting.Dictionary")

    Dim cell As Range
    Dim ws As Worksheet
    Dim datesRange As Range, valuesRange As Range
    Dim i As Long, dayKey As String
    Dim sumArr(1 To 7) As Double
    Dim countArr(1 To 7) As Long

    On Error Resume Next
    xTitleId = "KutoolsforExcel"

    Set ws = Application.ActiveSheet
    Set datesRange = Application.InputBox("Select the date range", xTitleId, Selection.Address, Type:=8)
    Set valuesRange = Application.InputBox("Select the corresponding values range", xTitleId, "", Type:=8)

    For i = 1 To datesRange.Count
        If IsDate(datesRange.Cells(i).Value) Then
            Dim wd As Integer
            wd = Weekday(datesRange.Cells(i).Value, 2)
            sumArr(wd) = sumArr(wd) + valuesRange.Cells(i).Value
            countArr(wd) = countArr(wd) + 1
        End If
    Next i

    Dim resWs As Worksheet
    Set resWs = Worksheets.Add
    resWs.Name = "Weekday Averages"
    resWs.Cells(1, 1).Value = "Weekday"
    resWs.Cells(1, 2).Value = "Average"

    Dim dayNames As Variant
    dayNames = Array("Monday", "Tuesday", "Wednesday", "Thursday", "Friday", "Saturday", "Sunday")

    For i = 1 To 7
        resWs.Cells(i + 1, 1).Value = dayNames(i - 1)
        If countArr(i) > 0 Then
            resWs.Cells(i + 1, 2).Value = sumArr(i) / countArr(i)
        Else
            resWs.Cells(i + 1, 2).Value = "No data"
        End If
    Next i
End Sub
2. To run the macro, click the ![]() button or press F5. A prompt will appear for you to select the date range (e.g., D2:D15) and the corresponding value range (e.g., E2:E15).
button or press F5. A prompt will appear for you to select the date range (e.g., D2:D15) and the corresponding value range (e.g., E2:E15).
The macro creates a new worksheet summarizing the average for each weekday. "Average" will be calculated for Monday through Sunday, and if any weekday has no corresponding data, "No data" will be displayed.
Precautions and tips:
- Ensure both ranges (dates and values) are the same size and aligned row to row.
- Macro execution requires saving your workbook as a macro-enabled file (*.xlsm).
- If you encounter an error, check that your ranges do not contain empty or invalid entries.
- You can modify the code to include a filter for specific weekdays or expand the summary.
Pivot Table - Use Pivot Table to group dates by weekday and calculate averages without formulas
Another method to analyze and average your data by the day of the week is by using Pivot Tables. This approach is user-friendly and requires no manual formulas or coding. Pivot Tables allow you to dynamically group data, calculate averages, and quickly update results as your data changes.
Advantages: Fast to set up, works with large datasets, updates automatically when new data is added, and supports further analysis (e.g., filtering, sorting).
Disadvantages: Requires data to be organized in an Excel Table or structured range; limited customization compared to VBA solutions.
Operation steps:
1. Add a helper column for weekday names:
In an empty column (e.g., F), enter in F2:
=TEXT(D2,"dddd")Copy the formula down to match your data rows. (Assumes dates are in D2:D15.)
2. Select your source range including the helper column (e.g., D2:F15). For best results, convert it to an Excel Table (Ctrl+T), then keep the selection active.
3. Go to Insert > PivotTable. In the Create PivotTable dialog, choose where to place it (new worksheet is recommended) and click OK.
4. In the PivotTable Fields pane:
— Drag the Weekday helper field (column F) to the Rows area.
— Drag your numeric field (e.g., Orders from column E) to the Values area.
5. Change the aggregation to average:
Click the drop-down in the Values area > Value Field Settings > choose Average > OK.
6. (Optional) Sort weekdays Monday→Sunday:
Right-click any weekday label > Sort > More Sort Options, or add a small custom sort helper (1–7) and sort by it. You can also format numbers via Value Field Settings > Number Format.
7. Refresh when data changes:
After updating the source table, click anywhere in the PivotTable and choose Refresh (or Data > Refresh All).
Tips and troubleshooting:
- Ensure the date column contains valid Excel dates (not text); otherwise the weekday formula may fail.
- If averages look incorrect, verify the Values field is set to Average, not Sum.
- After changing or adding rows in the source table, use Refresh so the PivotTable recalculates.
- For locale settings using semicolons, enter
=TEXT(D2;"dddd")instead.
Using Pivot Tables for day-of-week analysis simplifies the process and helps you create interactive reports, which are particularly useful for presentations or sharing insights with others.

Unlock Excel Magic with Kutools AI
- Smart Execution: Perform cell operations, analyze data, and create charts—all driven by simple commands.
- Custom Formulas: Generate tailored formulas to streamline your workflows.
- VBA Coding: Write and implement VBA code effortlessly.
- Formula Interpretation: Understand complex formulas with ease.
- Text Translation: Break language barriers within your spreadsheets.
Related articles:
How to calculate average between two dates in Excel?
How to average cells based on multiple criteria in Excel?
How to average top or bottom3 values in Excel?
Best Office Productivity Tools
Supercharge Your Excel Skills with Kutools for Excel, and Experience Efficiency Like Never Before. Kutools for Excel Offers Over 300 Advanced Features to Boost Productivity and Save Time. Click Here to Get The Feature You Need The Most...
Office Tab Brings Tabbed interface to Office, and Make Your Work Much Easier
- Enable tabbed editing and reading in Word, Excel, PowerPoint, Publisher, Access, Visio and Project.
- Open and create multiple documents in new tabs of the same window, rather than in new windows.
- Increases your productivity by 50%, and reduces hundreds of mouse clicks for you every day!
All Kutools add-ins. One installer
Kutools for Office suite bundles add-ins for Excel, Word, Outlook & PowerPoint plus Office Tab Pro, which is ideal for teams working across Office apps.
- All-in-one suite — Excel, Word, Outlook & PowerPoint add-ins + Office Tab Pro
- One installer, one license — set up in minutes (MSI-ready)
- Works better together — streamlined productivity across Office apps
- 30-day full-featured trial — no registration, no credit card
- Best value — save vs buying individual add-in