How to apply color banded rows or columns in Excel?
When working with large datasets in Excel, visually organizing information is essential for clarity and quick analysis. One effective way to improve readability is to apply color bands (alternating colors) to rows or columns. Banded formatting helps you easily distinguish between different sections of data, reduces errors when reading across rows or down columns, and enhances the professional appearance of your worksheets. This article will provide guidance on several practical methods to apply color banded rows or columns in Excel, covering both built-in Excel features and enhanced tools. Each solution caters to different user needs and scenarios, including automated options, manual control, and programmatic approaches for advanced users.
Apply banded rows or columns with Conditional Formatting
Apply banded rows or columns with inserting Table
Apply banded rows or columns with Kutools for Excel
Use VBA macro to apply alternating colors to rows or columns
Use Excel formulas in helper columns to mark banded rows or columns
Apply banded rows or columns with Conditional Formatting
You can create a Conditional Formatting rule to automatically add alternating row or column shading, which is flexible and updates as your data changes. This method is ideal when you need dynamic formatting for any range, whether your data grows or shrinks.
1. Select the range where you wish to apply banded rows or columns. Go to the Home tab and choose Conditional Formatting > New Rule. This allows for color alternation automatically without manually formatting each row or column.

2. In the New Formatting Rule dialog box, follow these detailed steps:

Now, your selected cells display an alternating color pattern based on your specifications. This method automatically adapts if you add or remove rows and columns, making it suitable for dynamic datasets.

Tips:
- You can adjust the formula (for example, use =MOD(ROW(),3)=0) for custom band widths such as every third row.
- If you want to remove the banded formatting, revisit Conditional Formatting and choose "Clear Rules" from the menu.
Apply banded rows or columns with inserting Table
Another straightforward method is converting your data range into an Excel Table. The Table feature automatically applies alternating colors and offers additional sorting and filtering capabilities. This approach is best if you want instant banding and commonly use Table tools.
1. Select the range you want to apply color bands to, then navigate to Insert > Table. Excel will prompt you to confirm your selection.

2. In the Create Table dialog box, verify the range and whether your table has headers, then click OK.

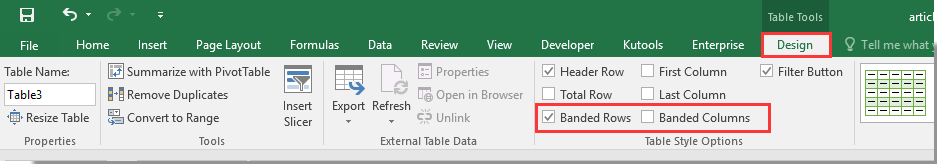
3. Once your range is converted, the Design tab appears. Here you can modify table style options. To apply color bands:
- Check Banded Rows for alternating row colors.
- Check Banded Columns for alternating column colors.
This method instantly adds color bands and ensures your formatting will persist if the table is expanded or condensed. However, note that some advanced formatting limitations may occur compared to Conditional Formatting.
Tips:
- You can further adjust the banding style from built-in Table Styles in the Design tab.
- Keep in mind, converting a range to a Table changes some worksheet behaviors (such as formulas referencing Table objects instead of cell addresses).
Apply banded rows or columns with Kutools for Excel
If you regularly need to apply or remove alternate shading, the Alternate Row / Column Shading tool in Kutools for Excel offers an efficient one-click solution with more customizable options than default Excel features. This tool simplifies the formatting process for both basic and advanced users, especially when handling large datasets or needing to adjust banding frequency.
1. Highlight the range to which you want to apply banded formatting. Go to Kutools > Format > Alternate Row / Column Shading in the ribbon.

2. In the Alternate Row / Column Shading dialog box, configure your preferences as follows:

Once complete, the banded shading appears instantly. Kutools for Excel allows you to remove or adjust banding with a single click and supports greater customization in formatting patterns.

Note: To fully remove shading, use the Remove existing alternate row shading option in Kutools. This is helpful if you need to reformat or clear prior styles.

Practical Considerations:
- Kutools retains your conditional or static formats even after you close and reopen the workbook.
- If the feature does not work as expected, check for merged cells in your selected range or existing conflicting formatting rules.
Kutools for Excel - Supercharge Excel with over 300 essential tools, making your work faster and easier, and take advantage of AI features for smarter data processing and productivity. Get It Now
Use VBA macro to apply alternating colors to rows or columns
Advanced users can programmatically apply banded formatting using VBA macros in Excel. This method is ideal when you need to automate coloring across many sheets, customize color schemes, or repeatedly process data. VBA is also helpful if built-in Excel features do not provide enough flexibility.
Pros:
- Complete control over color choices, patterns, and scope.
- Automate repetitive banding tasks, saving time.
- Requires enabling macros and basic understanding of VBA.
- May not be suitable for non-technical users or strict security environments.
1. Access the VBA editor by clicking Developer Tools > Visual Basic (if Developer tab is hidden, enable it first from Excel Options). In the VBA window, click Insert > Module to add a new code module. Copy and paste the following macro code into the module:
Sub ApplyAlternatingColors()
    Dim rng As Range
    Dim i As Long
    Dim colBanding As Boolean
    Dim bandColor1 As Long
    Dim bandColor2 As Long

    On Error Resume Next
    xTitleId = "KutoolsforExcel"

    Set rng = Application.Selection
    Set rng = Application.InputBox("Select the range to apply banded colors", xTitleId, rng.Address, Type:=8)

    colBanding = (MsgBox("Apply banding to Columns? Click No for Rows.", vbYesNo + vbQuestion, xTitleId) = vbYes)

    bandColor1 = Application.InputBox("First color code (e.g.,15 for gray)", xTitleId, 15, Type:=1)
    bandColor2 = Application.InputBox("Second color code (e.g.,2 for white)", xTitleId, 2, Type:=1)

    If colBanding Then
        For i = 1 To rng.Columns.Count
            If i Mod 2 = 0 Then
                rng.Columns(i).Interior.ColorIndex = bandColor1
            Else
                rng.Columns(i).Interior.ColorIndex = bandColor2
            End If
        Next i
    Else
        For i = 1 To rng.Rows.Count
            If i Mod 2 = 0 Then
                rng.Rows(i).Interior.ColorIndex = bandColor1
            Else
                rng.Rows(i).Interior.ColorIndex = bandColor2
            End If
        Next i
    End If
End Sub2. After pasting the code, click the ![]() button to run the macro. A dialog will prompt you to select your target range, choose whether to apply banding to rows or columns, and specify color codes. For color codes, use standard Excel color index values (e.g., 15 for gray, 2 for white, 36 for light yellow). Click OK as prompted to complete the operation.
button to run the macro. A dialog will prompt you to select your target range, choose whether to apply banding to rows or columns, and specify color codes. For color codes, use standard Excel color index values (e.g., 15 for gray, 2 for white, 36 for light yellow). Click OK as prompted to complete the operation.
Tips:
- If you want to undo the colored bands, simply select the range again and set both colors to the same value (e.g., 2 for white).
- Common errors include selecting non-continuous ranges or protected sheets—you may need to unprotect your sheet before running the macro.
Use Excel formulas in helper columns to mark banded rows or columns
In some cases, you may want flexible control over marking which rows or columns should be banded, especially when your banding pattern is irregular or you wish to filter data by banding. Using helper columns (or rows) with simple formulas allows you to create visual markers for manual or auto-formatting.
Pros:
- Can provide logical tracking for custom banding patterns.
- Works well when you want to filter, sort, or conditionally format based on formula results.
- Requires some manual formatting to apply colors after marking.
- Extra columns/rows may make your worksheet layout more complex.
1. Insert a helper column next to your dataset (for example, column A if your data starts in column B). In the first row of the helper column, enter the following formula:
=MOD(ROW(),2)This formula returns 0 for even rows and 1 for odd rows. If you want banded columns, use:
=MOD(COLUMN(),2)2. Drag the formula down or across to fill all relevant rows or columns. You can then use Conditional Formatting based on the values in the helper column (see Conditional Formatting solution above) with the following formula to color the marked bands manually.
=$E1=0Tips:
- This formula helps to highlight rows with the value 0 in column E.
- You may customize the formula for wider bands (e.g., =MOD(ROW()-1,3) for bands of 3 rows).
- After creating markers, use Conditional Formatting with color fill based on the helper column values for automation.
Best Office Productivity Tools
Supercharge Your Excel Skills with Kutools for Excel, and Experience Efficiency Like Never Before. Kutools for Excel Offers Over 300 Advanced Features to Boost Productivity and Save Time. Click Here to Get The Feature You Need The Most...
Office Tab Brings Tabbed interface to Office, and Make Your Work Much Easier
- Enable tabbed editing and reading in Word, Excel, PowerPoint, Publisher, Access, Visio and Project.
- Open and create multiple documents in new tabs of the same window, rather than in new windows.
- Increases your productivity by 50%, and reduces hundreds of mouse clicks for you every day!
All Kutools add-ins. One installer
Kutools for Office suite bundles add-ins for Excel, Word, Outlook & PowerPoint plus Office Tab Pro, which is ideal for teams working across Office apps.
- All-in-one suite — Excel, Word, Outlook & PowerPoint add-ins + Office Tab Pro
- One installer, one license — set up in minutes (MSI-ready)
- Works better together — streamlined productivity across Office apps
- 30-day full-featured trial — no registration, no credit card
- Best value — save vs buying individual add-in