How to Calculate Z-Scores in Excel: A Comprehensive Guide
In the realm of statistics and data analysis, understanding how your data compares to the average is crucial. A z-score, also known as a standard score, provides a way to measure the relative distance of a data point from the mean of a dataset, expressed in terms of standard deviations. Whether you're analyzing test scores, financial data, or any other numerical dataset, calculating z scores can offer profound insights into your data's behavior.
Using Excel to calculate z-scores offers simplicity and efficiency, enabling quick analysis of large datasets for standardized comparison and outlier detection. This tutorial will guide you through understanding what a z-score is, how to find it in Excel, provide formula examples, interpret z scores in your data, and share important tips to remember when performing these calculations. | 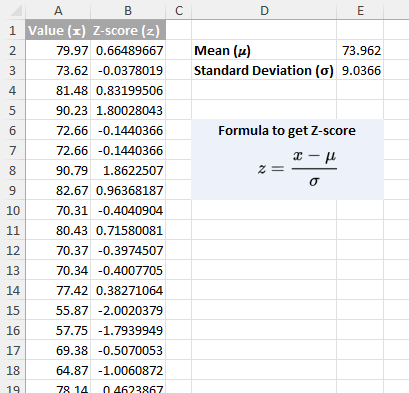 |
What is a z-score?
A z-score, also known as a standard score, is a statistical metric that quantifies the distance of a specific data point from the mean of a dataset, expressed in terms of standard deviations. This measurement is crucial for understanding how far and in which direction (above or below) a data point deviates from the average value of the dataset. In essence, a z-score transforms data points onto a common scale, allowing for straightforward comparison across different datasets or within diverse populations, regardless of the original scales of measurement or distribution shapes.
The concept of z-score is intimately linked with the normal distribution. The normal distribution is a fundamental concept in statistics, representing a distribution where most observations cluster around the central peak and the probabilities for values to occur decrease symmetrically in both directions from the mean. In the context of a normal distribution: |
|

- Approximately 68% of the data falls within one standard deviation (±1 z-score) of the mean, indicating a moderate deviation from the average.
- About 95% of observations lie within two standard deviations (±2 z-scores), showing a significant but not extreme deviation.
- Nearly 99.7% of data is found within three standard deviations (±3 z-scores), encompassing almost all observations within a distribution and highlighting extreme deviations.
The z-score is a vital tool in statistical analysis, enabling researchers and analysts to standardize individual observations from different datasets, facilitating the comparison of scores from distinct distributions. By converting data to z-scores, one can easily determine how unusual or typical a particular observation is within a given distribution, making it an indispensable tool for various applications, including outlier detection, hypothesis testing, and data normalization.
How to find z-score in Excel?
In Excel, there isn't a single, dedicated function for computing z-scores directly. The process involves initial calculations of your dataset's mean (μ) and standard deviation (σ). After obtaining these essential statistics, you have two primary methods to determine the z-score:
- Manual Calculation Method: Apply the z-score formula:
=(x-μ)/σ - where:
- x is the data point you're examining,
μ is the mean of your dataset,
σ is the standard deviation of your dataset. - Using the STANDARDIZE Function: For a more integrated approach, Excel's STANDARDIZE function calculates the z-score directly given the data point, the mean, and the standard deviation as inputs:
=STANDARDIZE(x, mean, standard_dev)
Formula examples to calculate z-score in Excel
Assuming you possess a dataset in column A, spanning from cells A2 to A101, here's how you would go about calculating the z-score for these values:
- Calculate the Mean (μ): Use the AVERAGE(range) function to find the mean (μ) of your dataset.
=AVERAGE(A2:A101)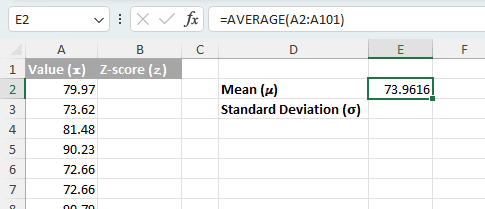
- Calculate the Standard Deviation (σ): Select the appropriate formula based on your data context.
Important: Choosing the right function for your dataset is crucial for ensuring precise calculations. (For my data in A2:A101 representing the entire population, I will use the first formula.)
- Use theSTDEV.P(range) function if your data represents the entire population (meaning there's no larger group these values are sampled from).
=STDEV.P(A2:A101) - Use the STDEV.S(range) function if your data is a sample of a larger population or you want to estimate the population standard deviation based on your sample.
=STDEV.S(A2:A101)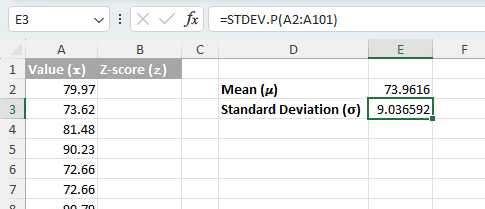
- Use theSTDEV.P(range) function if your data represents the entire population (meaning there's no larger group these values are sampled from).
- Calculate the Z-Score for Data Point in A2: Use either of the following formulas, which will yield the same result. (In this instance, I'll opt for the second formula.)
- Manually calculate by subtracting the mean from the data point and dividing this result by the standard deviation.
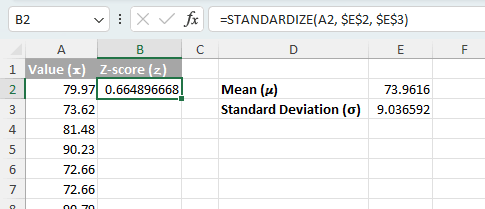
=(A2 - $E$2) / $E$3 - Use the STANDARDIZE(x, mean, standard_dev) function.
=STANDARDIZE(A2, $E$2, $E$3)Note: The dollar signs ($) tell the formula to always reference specific cells (E2 for mean, E3 for standard deviation) regardless of where the formula is copied.
- Manually calculate by subtracting the mean from the data point and dividing this result by the standard deviation.
- Calculate Z-Scores for Each Value in Your Dataset: Copy the formula in step 3 down the column to calculate z-scores for each value in your dataset. Tip: Double-click the cell's fill handle to quickly extend the formula.


- To streamline your calculation of z-scores across the entire dataset without individually typing out formulas for the mean and standard deviation in separate cells, you can employ either of the following comprehensive formulas directly.
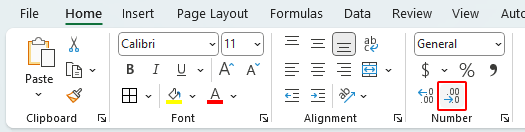
=(A2 - AVERAGE($A$2:$A$101)) / STDEV.P($A$2:$A$101)=STANDARDIZE(A2, AVERAGE($A$2:$A$101), STDEV.P($A$2:$A$101)) - Maintaining a consistent precision by using three decimal places for z-scores is a commendable practice in scientific and statistical work. Achieve this by selecting your z-score cells and utilizing the "Decrease Decimal" option found in the Number group on the Home tab.

Interpreting z-scores in data
Interpreting z-scores is fundamental in understanding the position and significance of data points within a dataset. A z-score provides a direct measurement of how many standard deviations an element is from the dataset's mean, offering insights into its relative position and rarity.
Relation to Mean
- Z-Score = 0: Indicates average performance, with the data point exactly at the mean.
- Z-Score > 0: Denotes above-average values, with greater distances from the mean signaling stronger performance.
- Z-Score < 0: Represents below-average values, where lower scores mark a greater deviation below the mean.
Degree of Deviation
- |Z-Score| < 1: These data points are close to average, falling within the main body of data in a normal distribution, signaling standard performance.
- |Z-Score| < 2: Suggests a moderate deviation from the mean, marking observations as uncommon but still within a normal range of variance.
- |Z-Score| > 2: Highlights unusual data points significantly far from the mean, potentially indicating outliers or substantial deviations from the expected norm.
Example Explanation:
- A z-score of 0.66 means the data point is 0.66 standard deviations above the mean. This indicates that the value is higher than the average but still relatively close to it, falling within the typical range of variation.
- Conversely, a z-score of -2.1 signifies that the data point is 2.1 standard deviations below the mean. This value is significantly lower than the average, indicating it is further away from the typical range.
Things to remember when calculating z-scores in Excel
When utilizing Excel to calculate z-scores, precision and accuracy are paramount. There are critical considerations to keep in mind to ensure the reliability of your results:
- Check for normal distribution: Z-scores are most effective for data that adheres to a normal distribution. If your dataset does not follow this distribution, z-scores might not serve as an appropriate analytical tool. Consider conducting a normality test before applying z-score analysis.
- Ensure correct formula use: Ensure you select the right standard deviation function - STDEV.P for entire populations and STDEV.S for samples - based on your dataset characteristics.
- Use absolute references for mean and standard deviation: When applying formulas across multiple cells, use absolute references (e.g., $A$1) for mean and standard deviation in your z-score formula to ensure consistency across calculations.
- Be cautious of outliers: Outliers have a significant impact on both the mean and standard deviation, potentially skewing the z-scores calculated.
- Ensure data integrity: Before calculating z-scores, ensure your dataset is clean and free from errors. Incorrect data entries, duplicates, or irrelevant values can significantly impact the mean and standard deviation, leading to misleading z-scores.
- Avoid premature rounding or truncating: Excel can handle a significant number of decimal places, and preserving these can prevent cumulative rounding errors that might distort your final analysis.
Above is all the relevant content related to calculating z-scores in Excel. I hope you find the tutorial helpful. If you're looking to explore more Excel tips and tricks, please click here to access our extensive collection of over thousands of tutorials.
The Best Office Productivity Tools
Kutools for Excel - Helps You To Stand Out From Crowd
Kutools for Excel Boasts Over 300 Features, Ensuring That What You Need is Just A Click Away...
Office Tab - Enable Tabbed Reading and Editing in Microsoft Office (include Excel)
- One second to switch between dozens of open documents!
- Reduce hundreds of mouse clicks for you every day, say goodbye to mouse hand.
- Increases your productivity by 50% when viewing and editing multiple documents.
- Brings Efficient Tabs to Office (include Excel), Just Like Chrome, Edge and Firefox.