How to change the gap width in Excel quickly?
In Microsoft Excel, charts are a crucial tool for visually interpreting data and trends. By default, Excel calculates the gap width—the space between categories or series in a column or bar chart—automatically, based on the amount of data and the overall area allocated for the chart. However, this automatic adjustment does not always yield ideal results: when you have many series, the columns may become tightly packed and difficult to distinguish; with fewer series, the chart might have large empty spaces that reduce readability and visual balance. Manually adjusting the gap width can greatly improve the clarity and appearance of your charts, ensuring your data is presented in the most effective way possible.
Manually customizing the gap width allows you to control how closely columns or bars are spaced, providing flexibility to emphasize certain data relationships or to fit your chart to specific presentation needs. This is especially valuable when preparing charts for reports, presentations, or dashboards, where visual impact and readability are key. The following steps walk you through how to quickly modify the gap width for chart series in Excel, with practical tips and reminders to help you avoid common pitfalls.
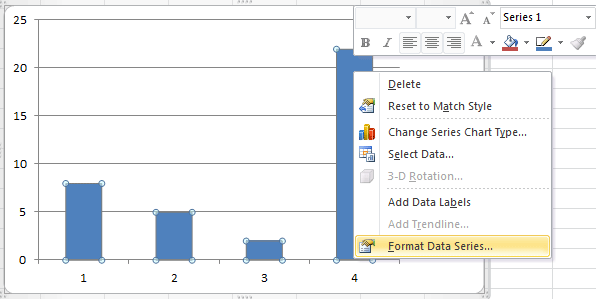
First, begin by selecting the chart for which you want to change the gap width. With the chart selected, locate the data series (columns or bars) whose spacing you wish to modify. Next, right-click on one of the series in the chart area. From the context menu that appears, select the Format Data Series option. This action will open a dedicated formatting pane or dialog box, depending on your version of Excel. See the following screenshot for reference:
After the Format Data Series pane opens, look for the options on the left sidebar or at the top, and click Series Options. In this section, you will see a control labeled Gap Width, typically represented by a slider and a percentage value. The default gap width is usually set to 150%, but you can adjust it according to your needs. The illustration below shows where to find the Gap Width setting:

Now, manually drag the slider left or right to decrease or increase the gap between your columns or bars. Sliding towards "No Gap" makes the bars wider and the spacing smaller, suitable for highlighting dense data or emphasizing the overall magnitude. Sliding towards "Large Gap" increases the space between series, which is helpful if your chart appears too crowded or you want to differentiate between categories more distinctly. Alternatively, you can enter a specific percentage value for precise control.
Tips:
- A smaller gap width (e.g.,50% or below) makes columns or bars appear thicker and closer together; this is best when you have only a few data points and want to emphasize their size relative to each other.
- A larger gap width (e.g., above 150%) works well when your chart includes many data series, helping to reduce visual clutter and making individual bars easier to distinguish.
- Changing gap width only affects the selected data series. If you want all series in a clustered bar or column chart to match, make sure the desired series are selected, or repeat the process for each one if needed.
- If the gap width slider is inactive, double-check that you are working with a column or bar chart, as other chart types may not support gap width adjustments.
Practical Caution: After modifying the gap width, preview your chart to ensure that the new spacing achieves your desired visual effect and does not obscure important data. If necessary, experiment with different gap widths and compare before committing to your final layout.
Troubleshooting: If you cannot find the "Format Data Series" option, ensure that your chart type is compatible with gap width adjustments (this feature is primarily available in column and bar charts, but not in line, pie, or scatter charts). For Excel versions where the formatting options appear as a pane on the right rather than a pop-up window, the controls may be located under different icons, such as the "bars" or "series" icon—explore these sections if you do not immediately see the gap width slider.
Alternative Methods: Besides manual adjustments via the formatting dialog, you can also double-click on the data series to open the Format Data Series pane more quickly. Additionally, if you often need to apply consistent gap widths across multiple charts, you may consider creating and applying a custom chart template.
Making appropriate use of the gap width adjustment option gives you more control over the appearance of your Excel charts, enhancing both their readability and communication effectiveness. Remember to save your workbook after making changes to preserve your customized chart layout.

Unlock Excel Magic with Kutools AI
- Smart Execution: Perform cell operations, analyze data, and create charts—all driven by simple commands.
- Custom Formulas: Generate tailored formulas to streamline your workflows.
- VBA Coding: Write and implement VBA code effortlessly.
- Formula Interpretation: Understand complex formulas with ease.
- Text Translation: Break language barriers within your spreadsheets.
Best Office Productivity Tools
Supercharge Your Excel Skills with Kutools for Excel, and Experience Efficiency Like Never Before. Kutools for Excel Offers Over 300 Advanced Features to Boost Productivity and Save Time. Click Here to Get The Feature You Need The Most...
Office Tab Brings Tabbed interface to Office, and Make Your Work Much Easier
- Enable tabbed editing and reading in Word, Excel, PowerPoint, Publisher, Access, Visio and Project.
- Open and create multiple documents in new tabs of the same window, rather than in new windows.
- Increases your productivity by 50%, and reduces hundreds of mouse clicks for you every day!
All Kutools add-ins. One installer
Kutools for Office suite bundles add-ins for Excel, Word, Outlook & PowerPoint plus Office Tab Pro, which is ideal for teams working across Office apps.
- All-in-one suite — Excel, Word, Outlook & PowerPoint add-ins + Office Tab Pro
- One installer, one license — set up in minutes (MSI-ready)
- Works better together — streamlined productivity across Office apps
- 30-day full-featured trial — no registration, no credit card
- Best value — save vs buying individual add-in