How to create funnel chart in Excel?
Have you ever wanted to create a funnel chart to show the data ascending or descending in Excel? In Excel, there is no a direct way to create a funnel chart, but now I will talk about a method to make a funnel chart in Excel.
Create funnel chart in Excel
There are several steps to create a funnel chart, please follow step by step.
1. Select the data range and click "Insert" > "Column" > "100% Stacked Pyramid". See screenshot:

Tip: In Excel 2013, do as follow to insert a "100% Stacked Pyramid".
(1).You need to insert a "3-D 100% Stacked Column" first. Click "Insert" > "Column" > "3-D 100%Stacked Column". See screenshot:

(2).And then right click at the column chart series to select "Format Data Series", and check "Full Pyramid" option. See screenshots:
 |
 |
2. Click at the chart, and click "Design" > "Switch Row/Column" in the "Data" group. See screenshot:

Now you can see the chart as shown as below:

3. Right click the chart to select "3-D Rotation" in the context menu. See screen shot:

4. In the "Format Chart Area" dialog, change the values in "X" and "Y" text boxes to zero in the "Rotation" section, and close this dialog. See screenshot:

In Excel 2013 change the values in "X" and" Y" text boxes to zero in the "3-D Rotation" section in the "Format Chart Area" pane.
Now the chart change to this:

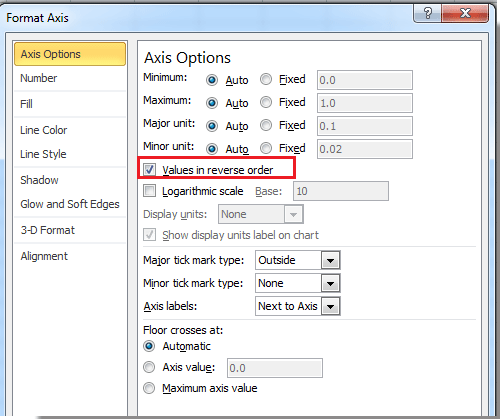
5. Right click at the "Y" axis and select "Format Axis", then check "Values in reverse order" option. See screenshots:
 |
 |
In Excel 2013 check "Values in reverse order" in "Format Axis" pane.
6. Close the dialog. And you can delete axis, legend, and chart floor as you need, and also you can add the data labels in the chart by right click at the series and select "Add Data Labels" one by one.
Now you can see a completed funnel chart.


Unlock Excel Magic with Kutools AI
- Smart Execution: Perform cell operations, analyze data, and create charts—all driven by simple commands.
- Custom Formulas: Generate tailored formulas to streamline your workflows.
- VBA Coding: Write and implement VBA code effortlessly.
- Formula Interpretation: Understand complex formulas with ease.
- Text Translation: Break language barriers within your spreadsheets.
Relative Articles:
Best Office Productivity Tools
Supercharge Your Excel Skills with Kutools for Excel, and Experience Efficiency Like Never Before. Kutools for Excel Offers Over 300 Advanced Features to Boost Productivity and Save Time. Click Here to Get The Feature You Need The Most...
Office Tab Brings Tabbed interface to Office, and Make Your Work Much Easier
- Enable tabbed editing and reading in Word, Excel, PowerPoint, Publisher, Access, Visio and Project.
- Open and create multiple documents in new tabs of the same window, rather than in new windows.
- Increases your productivity by 50%, and reduces hundreds of mouse clicks for you every day!
All Kutools add-ins. One installer
Kutools for Office suite bundles add-ins for Excel, Word, Outlook & PowerPoint plus Office Tab Pro, which is ideal for teams working across Office apps.
- All-in-one suite — Excel, Word, Outlook & PowerPoint add-ins + Office Tab Pro
- One installer, one license — set up in minutes (MSI-ready)
- Works better together — streamlined productivity across Office apps
- 30-day full-featured trial — no registration, no credit card
- Best value — save vs buying individual add-in