How to sum multiple columns based on single criteria in Excel?
In Excel, you might frequently encounter scenarios where you need to calculate the total sum across multiple columns but only for rows that match a specific criterion. For example, suppose you have a dataset that records sales for different products over several months. Now you need to get the total sales for a particular product, such as "KTE", for the months of Jan, Feb, and Mar only. This type of requirement can often arise in business reports, performance tracking, or inventory management.

Sum multiple columns based on single criteria with a helper column
Sum multiple columns based on single criteria with an array formula
Sum multiple columns based on single criteria with an awesome feature
Pivot Table - Create a Pivot Table to summarize and filter by criteria
Sum multiple columns based on single criteria with a helper column
In Excel, one straightforward approach is to use a helper column to first sum all relevant columns for each row. After that, you can easily compute the grand total for your specific criterion using the SUMIF function. This method is highly visual and helps you check the intermediate calculations step by step, which is useful for troubleshooting or audit purposes. However, it does introduce an extra column to your data, which some users might prefer to avoid if they want to keep their dataset streamlined.
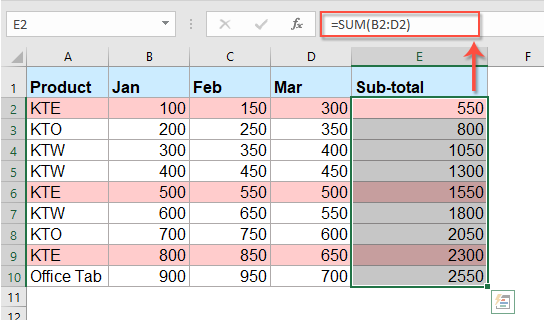
1. For this example, to sum all values for each row, enter the following formula in column E (starting in E2): =SUM(B2:D2). Drag the fill handle down through all relevant rows to apply the formula, instantly seeing the row totals for each product. See screenshot:
2. Next, use the SUMIF function to add the values in your helper column that meet your criterion. Enter this formula in your destination cell (for example, H2):
After pressing Enter, you'll see the total for your chosen product or criterion. See screenshot:
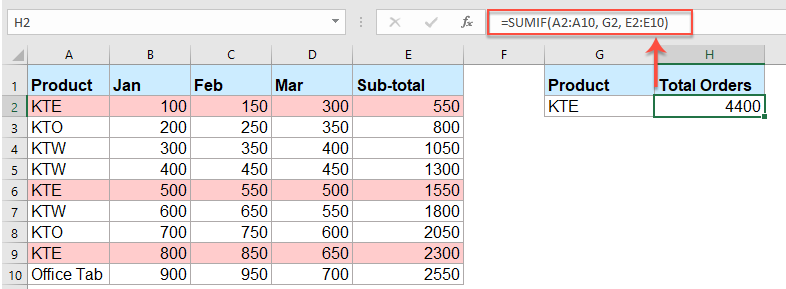
Tips: In the above formula:
- A2:A10 is the range you want to check for your criterion (e.g., product name).
- G2 contains the criterion to match (e.g., "KTE").
- E2:E10 lists the sums from your helper column.
This method is best when you want transparency in calculations and easily see row-wise totals. Be aware that extra columns might clutter your sheet in large datasets.
lookup and sum all the matching values in rows or columns
Kutools for Excel's LOOKUP and Sum feature helps you to lookup the specific value and get the summation of all the matching values in rows or columns as you need. Click to download Kutools for Excel!
Kutools for Excel: with more than 300 handy Excel add-ins, free to try with no limitation in 30 days. Download and free trial Now!
Sum multiple columns based on single criteria with an array formula
If you prefer not to add a helper column to your worksheet, you can use an array formula that dynamically calculates the sum across multiple columns based on your criteria. This approach keeps your data compact and avoids modifying the original table structure.
1. Enter or paste the formula below into your desired cell (e.g., G2):
2. For Excel versions that do not support dynamic array functions, confirm the formula by pressing Ctrl + Shift + Enter (not just Enter). For modern Excel (Office365 and Excel2021+), you can press Enter directly. The result will display the total for your criterion.
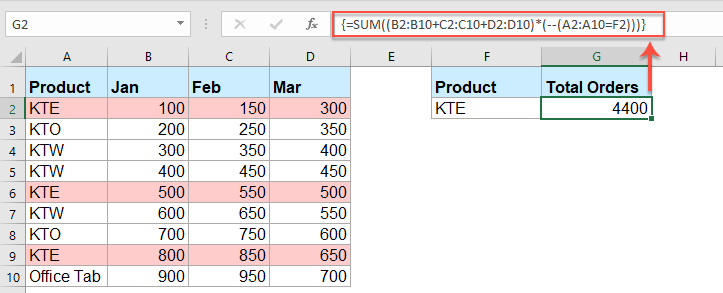
Tips: In this formula,
- B2:B10, C2:C10 and D2:D10 refer to the columns you want to sum. To include more columns, simply add more ranges.
- A2:A10 is the range checked for your criterion.
- F2 holds the criterion you want to match.
Array formulas are powerful, but they require careful entry. If your formula does not output the expected result, check that you used the proper keystrokes (Ctrl + Shift + Enter for older Excel versions) and that your ranges are aligned. This method is best for compact, formula-based solutions and avoids changing your source data.
Sum multiple columns based on single criteria with an awesome feature
For a quick and easy way to perform this calculation—especially if you frequently need to sum across columns based on criteria—consider the LOOKUP and Sum feature in Kutools for Excel. This feature simplifies the process and lets you perform the operation without writing formulas or adding extra helper columns, saving you time and effort in complex tasks.
Tips:To access the LOOKUP from Bottom to Top feature, download Kutools for Excel first, and then apply the feature for streamlined results.
Once you have Kutools for Excel installed, proceed as follows:
1. Go to Kutools > Super LOOKUP > LOOKUP and Sum to open the feature dialog:

2. In the LOOKUP and Sum dialog box, specify:
- Lookup and sum matched value(s) in row(s) under the Lookup and Sum Type section;
- Your lookup value, output cell, and the relevant data range;
- Return the sum of all matched values under Options.

3. Click OK, and instantaneously get the total value for all matched records. See screenshot:

Download and free trial Kutools for Excel Now!
Kutools works best for users who want efficiency and automation, especially for larger datasets or repeated tasks. Please ensure Kutools is properly installed and enabled before using this feature.
Pivot Table - Summarize and filter sums across multiple columns with a criteria
Using a Pivot Table is a highly flexible and visual way to summarize and filter totals across multiple columns based on any criteria. This method is especially suited for large and dynamic data sets and for users who want to analyze and summarize data interactively without writing formulas or code.
You can quickly display totals for any chosen criterion, slice and dice data, change filters, and rearrange summary tables with just a few clicks. Pivot Tables are ideal for dashboards, ad-hoc reporting, and presentations where clarity and visual representation are important.
1. Select your full data range (including all columns and headers).
2. Go to Insert > PivotTable. In the dialog box, choose whether to place the Pivot Table in a new worksheet or the current worksheet, then click OK.
3. In the Pivot Table Fields pane, drag your criterion column (e.g., Product) into the Rows area. Then, drag each data column (e.g., Jan, Feb, Mar) you want to sum into the Values area. By default, these will be summed.
4. You can now filter the rows to show only the criterion you want (e.g., select only "KTE") using the filter drop-down in the Pivot Table.
Pivot Tables let you quickly see sums for any product/category and across any combination of columns. If your source data changes, just refresh the Pivot Table to update totals. For more refined display, format numbers or reorganize rows/columns within the table.
If you encounter errors, ensure all relevant columns have headers and your data is in a continuous range without blank rows or merged cells.
Pivot Tables do not require formulas and offer interactive analysis. However, they do not display formulas, so for transparency in audit or formula-driven reports, consider combining this approach with formula solutions as needed.
More relative articles:
- Sumif with multiple criteria in one column
- In Excel, SUMIF function is a useful function for us to sum cells with multiple criteria in different columns, but with this function, we can also sum cells based on multiple criteria in one column. In this article. I will talk about how to sum values with more than one criteria in same column.
- Sumif with one or more criteria in Excel
- In Excel, sum values based on one or more criteria is a common task for most of us, the SUMIF function can help us to quickly sum the values based on one condition and the SUMIFS function help us to sum values with multiple criteria. This article, I will describe how to sum with one or more criteria in Excel?
- Sumif Cell Values Between Two Given Dates In Google Sheets
- In my Google sheet, I have two columns which contain a date column and order column, now, I want to sum the order column cells based on the date column. For example, sum values between2018/5/15 and2018/5/22 as following screenshot shown. How could you solve this job in Google sheets?
- Sum Cells When Value Changes In Another Column
- When you work on Excel worksheet, sometime, you may need to sum cells based on group of data in another column. For example, here, I want to sum the orders in column B when the data changes in column A to get the following result. How could you solve this problem in Excel?
- Vlookup Across Multiple Sheets And Sum Results In Excel
- Supposing, I have four worksheets which have the same formatting, and now, I want to find the TV set in the Product column of each sheet, and get the total number of order across those sheets as following screenshot shown. How could I solve this problem with an easy and quick method in Excel?
Best Office Productivity Tools
Supercharge Your Excel Skills with Kutools for Excel, and Experience Efficiency Like Never Before. Kutools for Excel Offers Over 300 Advanced Features to Boost Productivity and Save Time. Click Here to Get The Feature You Need The Most...
Office Tab Brings Tabbed interface to Office, and Make Your Work Much Easier
- Enable tabbed editing and reading in Word, Excel, PowerPoint, Publisher, Access, Visio and Project.
- Open and create multiple documents in new tabs of the same window, rather than in new windows.
- Increases your productivity by 50%, and reduces hundreds of mouse clicks for you every day!
All Kutools add-ins. One installer
Kutools for Office suite bundles add-ins for Excel, Word, Outlook & PowerPoint plus Office Tab Pro, which is ideal for teams working across Office apps.
- All-in-one suite — Excel, Word, Outlook & PowerPoint add-ins + Office Tab Pro
- One installer, one license — set up in minutes (MSI-ready)
- Works better together — streamlined productivity across Office apps
- 30-day full-featured trial — no registration, no credit card
- Best value — save vs buying individual add-in