How to calculate standard error of the mean in Excel?
The standard error of the mean is a key statistic in understanding sampling distributions. In this article, we’ll show you how to calculate it in Excel using a simple formula that incorporates the standard deviation and sample size.
Calculate standard error of the mean in Excel
Calculate standard error of the mean in Excel
As you know, the Standard Error = Standard deviation / square root of total number of samples, therefore we can translate it to Excel formula as "Standard Error = STDEV(sampling range)/SQRT(COUNT(sampling range))".
For example, your sampling range is paced in the Range B1:G4 as below screenshot shown. You can select the cell you will place the calculated result, type the following formula, and press the "Enter" key.
=STDEV(B1:G4)/SQRT(COUNT(B1:G4))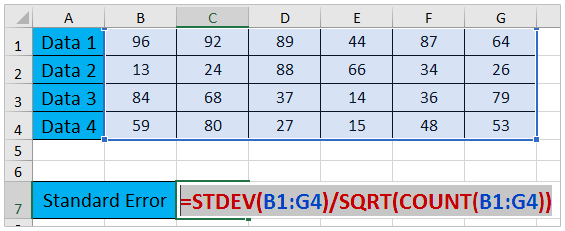
Now you can see the calculated standard error of the mean, as shown in the screenshot below:
Related articles:
Effortlessly Create a Bell Curve Chart in Just 2 Steps with Kutools for Excel
Kutools for Excel is a powerful add-in with over 300+ features designed to boost your productivity. Its "Normal Distribution / Bell Curve (chart)" tool allows you to create a flawless bell curve chart in Excel in just 2 simple steps, saving you time and effort!
Kutools for Excel - Supercharge Excel with over 300 essential tools, making your work faster and easier, and take advantage of AI features for smarter data processing and productivity. Get It Now
Best Office Productivity Tools
Supercharge Your Excel Skills with Kutools for Excel, and Experience Efficiency Like Never Before. Kutools for Excel Offers Over 300 Advanced Features to Boost Productivity and Save Time. Click Here to Get The Feature You Need The Most...
Office Tab Brings Tabbed interface to Office, and Make Your Work Much Easier
- Enable tabbed editing and reading in Word, Excel, PowerPoint, Publisher, Access, Visio and Project.
- Open and create multiple documents in new tabs of the same window, rather than in new windows.
- Increases your productivity by 50%, and reduces hundreds of mouse clicks for you every day!
All Kutools add-ins. One installer
Kutools for Office suite bundles add-ins for Excel, Word, Outlook & PowerPoint plus Office Tab Pro, which is ideal for teams working across Office apps.
- All-in-one suite — Excel, Word, Outlook & PowerPoint add-ins + Office Tab Pro
- One installer, one license — set up in minutes (MSI-ready)
- Works better together — streamlined productivity across Office apps
- 30-day full-featured trial — no registration, no credit card
- Best value — save vs buying individual add-in