Excel FORECAST.ETS.CONFINT function
The FORECAST.ETS.CONFINT function calculates the confidence interval for the forecast value at the specified target date, which can be used along with the FORECAST.ETS function to grasp the forecast accuracy.
Note: This FORECAST.ETS.CONFINT function is only available in Excel 2016 and later versions, and not available in Excel for the Web, iOS, or Android.
Syntax
FORECAST.ETS.CONFINT(target_date, values, timeline, [confidence_level], [seasonality], [data_completion], [aggregation])
Arguments
- Target_date (required): A date/time or a numeric value for which you want to predict a value;
- Values (required): The existing or historical known values for which you want to predict the next point (y values);
- Timeline (required): A range of date/time or numeric values corresponding to the “Values” (x values);
- Confidence_level (optional): A numeric value between 0 and 1 (exclusive) used to indicate a confidence level. If omitted, the default is 95%;
- Seasonality (optional): A numeric value used to define the length of the seasonal pattern. It can be:
- Data_completion (optional): A numeric value specifies how to handle the missing points in the timeline. It can be:
- Aggregation (optional): A numeric value specifies which function will be used to aggregate several values with the same time stamp. The values and the corresponding functions are listed below.
| Numeric value | Function |
| 1 or omitted | AVERAGE |
| 2 | COUNT |
| 3 | COUNTA |
| 4 | MAX |
| 5 | MEDIAN |
| 6 | MIN |
| 7 | SUM |
Remarks
Return value
It returns a numeric value.
Example
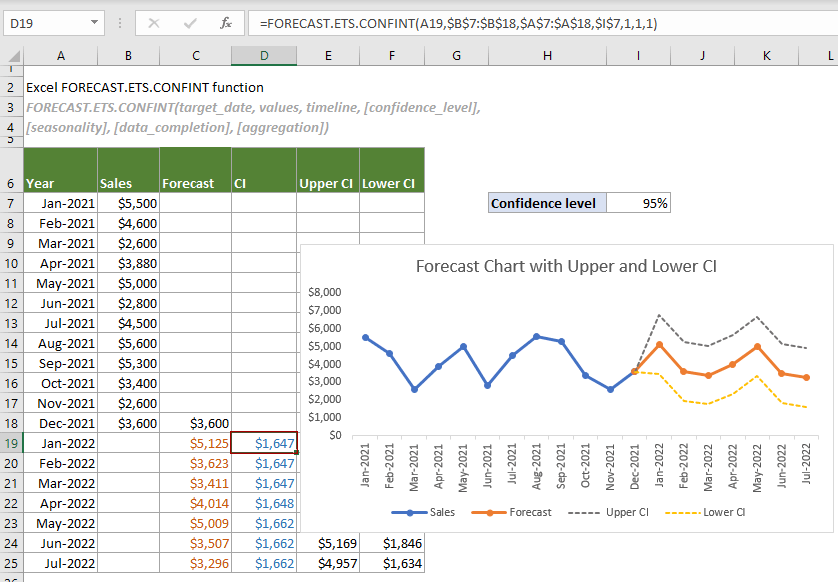
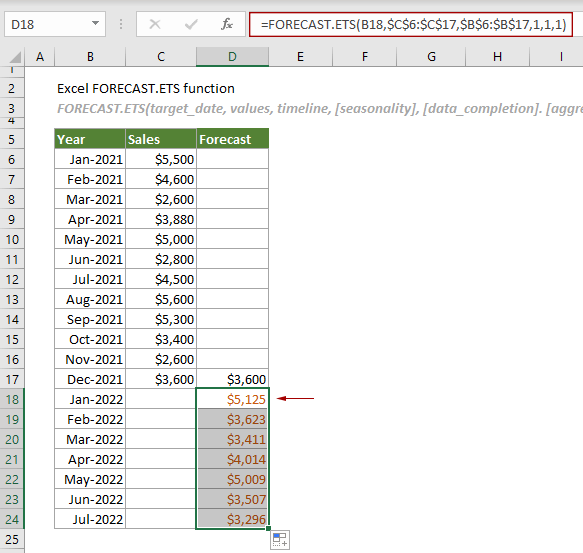
As shown in the table below, supposing you have applied the FORECAST.ETS function to predict the sales for January to July 2022 based on the existing monthly sales for 2021. Now you need to calculate the confidence intervals for the forecast values at the corresponding target dates and display the upper and lower confidence intervals in a forecast chart to help demonstrate the accuracy of the forecast values. Please do as follows to get it done.
1. Create three helper columns to locate the confidence intervals, upper confidence intervals, and the lower confidence intervals separately.
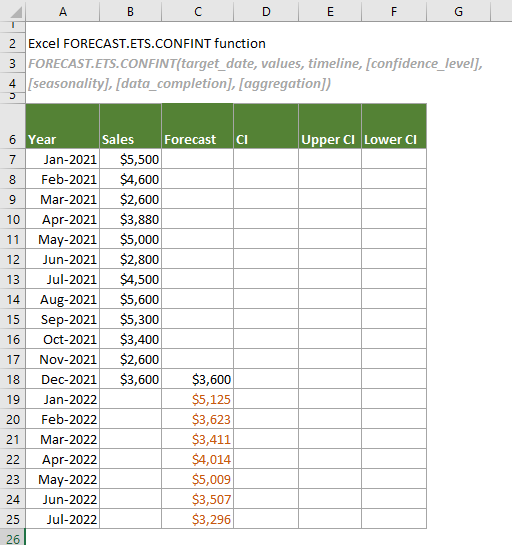
2. Calculate the confidence intervals for the forecast values at the specified target dates.
In the confidence interval column (the CI column in this case), select the cell (D19) next to the first predicted value (C19) in the Forecast column, copy or enter the formula below and press the Enter key to get the result. Then select this result cell and drag its AutoFill Handle down to get the confidence intervals for other forecast values.
=FORECAST.ETS.CONFINT(A19,$B$7:$B$18,$A$7:$A$18,$I$7,1,1,1)
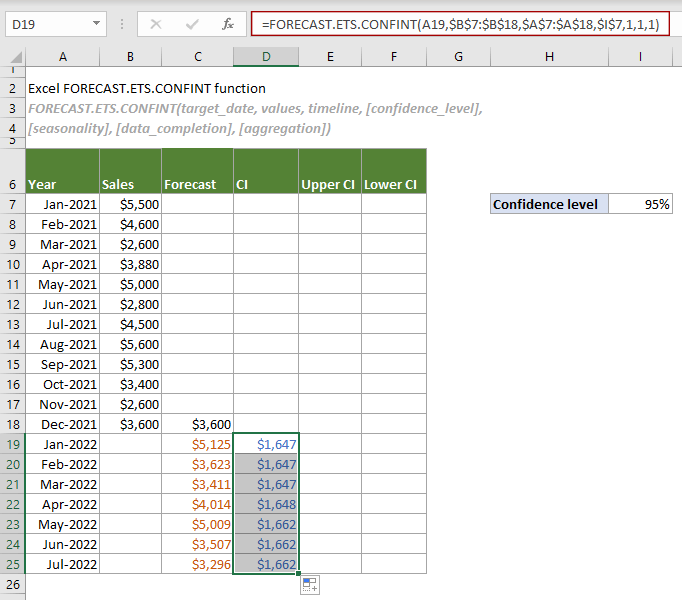
Note: In the formula, $I$7 is the cell containing the specified confidence level. This reference cell can be replaced with 0.95 or 95%.
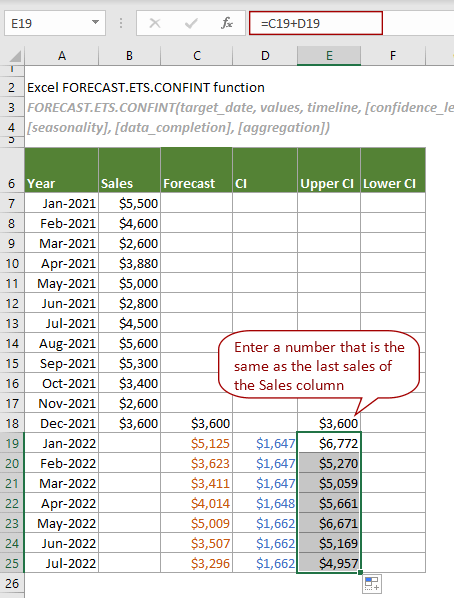
3. Calculate the upper confidence intervals.
In the Upper CI column, select a cell (E19 in this case) in the same row as the first forecast value, copy or enter the following formula and press Enter to get the result. Then select this result cell and drag its AutoFill Handle down to get other results.
=C19+D19
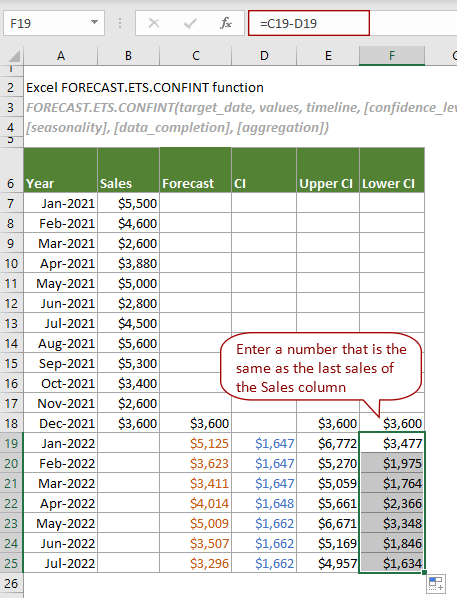
4. Calculate the lower confidence intervals.
In the Lower CI column, do the same operation as step 3 to calculate the lower confidence intervals with the following formula.
=C19-D19
Notes:
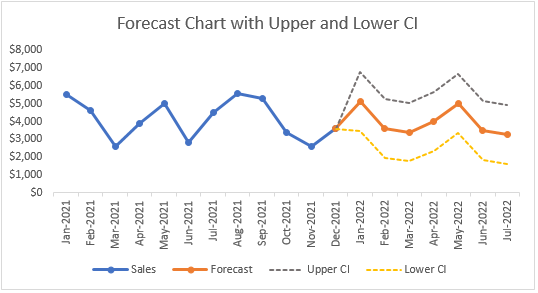
Now you can create a forecast chart with upper and lower confidence intervals as shown in the screenshot below.
Related Functions
Excel FORECAST function
The FORECAST function predicts a future value based on existing values by using the linear regression.
Excel FORECAST.ETS function
The FORECAST.ETS function uses the Exponential Smoothing (ETS) algorithm to predict a future value based on a series of existing values.
Excel FORECAST.ETS.SEASONALITY function
The FORECAST.ETS.SEASONALITY function returns the length of a seasonal pattern based on existing values and a timeline.
Excel FORECAST.ETS.STAT function
The FORECAST.ETS.STAT function returns a specified statistical value as a result of time series forecasting.
Excel FORECAST.LINEAR function
The FORECAST.LINEAR function predicts a future value based on existing values by using the linear regression.
The Best Office Productivity Tools
Kutools for Excel - Helps You To Stand Out From Crowd
Kutools for Excel Boasts Over 300 Features, Ensuring That What You Need is Just A Click Away...
Office Tab - Enable Tabbed Reading and Editing in Microsoft Office (include Excel)
- One second to switch between dozens of open documents!
- Reduce hundreds of mouse clicks for you every day, say goodbye to mouse hand.
- Increases your productivity by 50% when viewing and editing multiple documents.
- Brings Efficient Tabs to Office (include Excel), Just Like Chrome, Edge and Firefox.