Excel FORECAST.ETS.STAT function
The FORECAST.ETS.STAT function returns a specified statistical value as a result of time series forecasting.
Note:This FORECAST.ETS function is only available in Excel 2016 and later versions, and not available in Excel for the Web, iOS, or Android.
Syntax
FORECAST.ETS.STAT(values, timeline, statistic_type, [seasonality], [data_completion], [aggregation])
Arguments
- Values (required): The existing or historical known values for which you want to predict the next point (y values);
- Timeline (required): A range of date/time or numeric values corresponding to the “Values” (x values);
- Statistic_type (required): A numeric value between 1 and 8 specifies which statistic will be returned. The values and the corresponding statistics are as follows:
| Numeric value | Statistic | Description |
| 1 | Alpha parameter of ETS algorithm | The base value parameter: a higher value gives more weight to recent data point. |
| 2 | Beta parameter of ETS algorithm | The trend value parameter: a higher value gives more weight to the recent trend. |
| 3 | Gamma parameter of ETS algorithm | The seasonality value parameter: a higher value gives more weight to the recent seasonal period. |
| 4 | MASE metric | The mean absolute scaled error metric: a measure of the accuracy of forecasts. |
| 5 | SMAPE matric | The symmetric mean absolute percentage error metric: an accuracy measure based on percentage errors. |
| 6 | MAE metric | The mean absolute error metric: an accuracy measure based on percentage errors. |
| 7 | RMSE metric | The root mean squared error metric: a measure of the differences between predicted and observed values. |
| 8 | Step size detected | The step size detected in the historical timeline. |
- Seasonality (optional): A numeric value used to define the length of the seasonal pattern. It can be:
- Data_completion (optional): A numeric value specifies how to handle the missing points in the timeline. It can be:
- Aggregation (optional): A numeric value specifies which function will be used to aggregate several values with the same time stamp. The values and the corresponding functions are listed below.
| Numeric value | Function |
| 1 or omitted | AVERAGE |
| 2 | COUNT |
| 3 | COUNTA |
| 4 | MAX |
| 5 | MEDIAN |
| 6 | MIN |
| 7 | SUM |
Remarks
Return value
It returns a numeric value.
Example
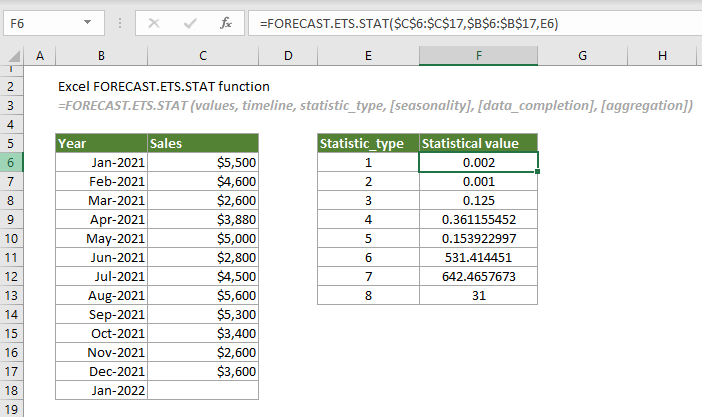
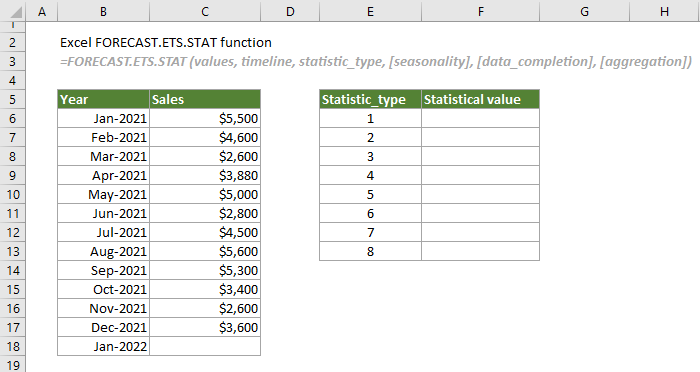
As shown in the table below, there is a monthly sales table for 2021 and you want to forecast the sales for Jan 2022 based on the existing sales using the FORECAST.ETS function. Before that, you want to know the statistical value relating to this forecast.
This case is going to calculate statistical values based on different statistic_type values listed in the range E6:E13.
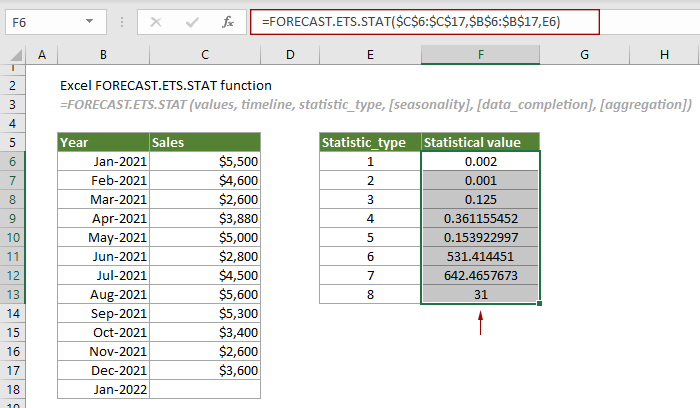
1. Select a cell (F6 in this case), copy or enter the formula below and press the Enter key to get the result. Select this result cell and drag its AutoFill Handle down to the cells where you want to apply this formula.
=FORECAST.ETS.STAT($C$6:$C$17,$B$6:$B$17,E6)
Note: The arguments “seasonality”, “data_completion” and “aggregation” are omitted in this case.
Related Functions
Excel FORECAST function
The FORECAST function predicts a future value based on existing values by using the linear regression.
Excel FORECAST.ETS function
The FORECAST.ETS function uses the Exponential Smoothing (ETS) algorithm to predict a future value based on a series of existing values.
Excel FORECAST.ETS.SEASONALITY function
The FORECAST.ETS.SEASONALITY function returns the length of a seasonal pattern based on existing values and a timeline.
Excel FORECAST.ETS.CONFINT function
The FORECAST.ETS.CONFINT function calculates the confidence interval for the forecast value at the specified target date.
Excel FORECAST.LINEAR function
The FORECAST.LINEAR function predicts a future value based on existing values by using the linear regression.
The Best Office Productivity Tools
Kutools for Excel - Helps You To Stand Out From Crowd
Kutools for Excel Boasts Over 300 Features, Ensuring That What You Need is Just A Click Away...
Office Tab - Enable Tabbed Reading and Editing in Microsoft Office (include Excel)
- One second to switch between dozens of open documents!
- Reduce hundreds of mouse clicks for you every day, say goodbye to mouse hand.
- Increases your productivity by 50% when viewing and editing multiple documents.
- Brings Efficient Tabs to Office (include Excel), Just Like Chrome, Edge and Firefox.