How to create Gantt chart in Excel?
Tracking and managing project schedules is essential for efficient workflow, and a Gantt chart offers a clear visual representation for this purpose. In Excel, a Gantt chart takes the form of a horizontal bar chart where each task is displayed along a timeline, making it easier to monitor start dates, durations, dependencies, and overall project progress at a glance. This visual overview is not only useful for experienced project managers but also for anyone coordinating a group of tasks. The following tutorial provides several solutions to build Gantt charts in Excel—ranging from manual methods, automated tools, conditional formatting approaches, and VBA automation—accommodating both basic needs and advanced requirements.
- Create a Gantt chart in Excel (13 steps)
- Create a Gantt chart with an amazing feature (4 steps)
- Automate Gantt Chart Creation and Formatting with VBA
Create a Gantt chart in Excel
You can create a Gantt chart with the following steps:
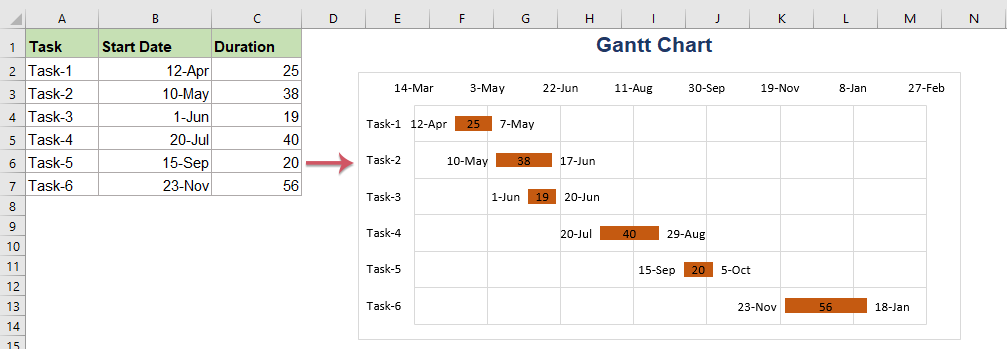
First, create your own task data range.
1. Prepare your task data in a structured format, including columns for Task Name, Start Date, and Duration (days). This clear setup is vital for accurate chart generation and simplifies later steps. For best results, make sure each task has a unique name and the date formats are consistent. Refer to the example below:

Second, insert a bar chart and add the data series.
2. Open the Insert tab, go to Insert Column or Bar Chart and choose Stacked Bar. A blank chart appears, ready to accept your data.
 |  |
3. To integrate your project data, right-click on the chart and select Select Data from the context menu. This enables you to assign your table’s Start Date and Duration columns to the chart.

4. In the Select Data Source dialog box, find Legend Entries (Series) and click Add. This action lets you specify the first series—the Start Dates.

5. The Edit Series dialog opens:
(1.) For Series name, select the header cell for Start Date (such as B1).
(2.) For Series values, select all Start Date cells for your tasks (e.g., B2 through B7).

6. Click OK and repeat the previous step to add the Duration data series, matching your column headers and task duration cells. After both series are added, you’ll notice colored bars representing each stage for every task:

7. Assign the right labels for your tasks. Under Horizontal (Category) Axis Labels in the same dialog, click Edit and select your Task Name cells. This ensures each bar corresponds to a specific activity, assisting project stakeholders with clarity.
 |  |
8. After clicking OK twice, your data series display as blue and orange bars (blue for Start Date, orange for Duration). At this point, your chart foundation is ready. If needed, confirm that the data ranges referenced are correct and adjust any misalignments before proceeding.

Third, format your bar chart.
9. By default, task order is reversed in Excel’s stacked bar chart. To rearrange from top-down, right-click on the vertical axis (Task Names) and select Format Axis.

10. Under Axis Options in the Format Axis pane, check Categories in reverse order. This adjustment enforces a logical top-down flow and matches common project management conventions.

11. Hide the Start Date bar for cleaner visuals: right-click any blue bar (representing Start Date), choose Format Data Series.

12. In the Format Data Series pane, select both No fill and No line under the Fill & Line section.

13. Minimize white space at the chart’s left by adjusting axis dates. Here’s how:
(1.) Select your earliest Start Date cell, right-click, and choose Format Cells. Under the Number tab select General and note the serial number displayed (e.g.,43933). Serial numbers represent Excel’s date values.

(2.) Then select the dates above the bar in the chart, and right click to choose Format Axis, and in the Format Axis pane, under the Axis Options icon:
- In the Minimum text box, input the numbers that you are recorded just now;
- In the Major text box, specify a time duration as you need.
 |  |
(3.) And then close the pane, your Gantt chart has been created as follows:

Manual Gantt chart creation with Excel bar charts gives full flexibility over design, labels, and time scales. However, for frequent updates and complex schedules, maintenance can be labor-intensive and error-prone. Always double-check ranges, use clear task naming, and, where possible, save templates for re-use.
Create a Gantt chart with an amazing feature
The above process covers manual Gantt chart construction, but if you need to produce and update project timelines regularly or want to save time, Kutools for Excel offers a streamlined alternative. Its specialized Gantt Chart tool lets you build timeline charts quickly using a simple interface.
1. Click Kutools > Charts > Point in Time > Gantt Chart, see screenshot:

2. In the Gantt Chart dialog box, specify:
- Select your Task Name cells in the Task Names box;
- Choose your Start Date cells for the Start Date/Time box;
- Assign the Duration column by selecting its cells.

3. Click Ok, and a prompt informs you a hidden sheet will be generated for calculation and charting purposes (this does not affect your main worksheet).

4. Select Yes, and the Gantt chart instantly appears, visually presenting your tasks’ spans and overlaps.

Automate Gantt Chart Creation and Formatting with VBA
When managing complex or frequently updated project timelines in Excel, automation becomes highly valuable. By using VBA (Visual Basic for Applications), you can build a macro that generates and formats a Gantt chart with minimal manual steps. This is suitable when you often change project data or need standardized visual output, especially for reports shared across teams.
1. Open your Excel workbook, and then access the VBA editor via Developer Tools > Visual Basic. In the new Microsoft Visual Basic for Applications window, click Insert > Module. Paste the following code into the module area:
Sub CreateGanttChart()
    Dim ws As Worksheet
    Dim ch As ChartObject
    Dim tNameRng As Range
    Dim startRng As Range
    Dim durRng As Range
    Dim lastRow As Long
    Dim chartSheet As Worksheet
    Dim xTitleId As String

    On Error Resume Next
    xTitleId = "KutoolsforExcel"

    Set ws = Application.ActiveSheet

    ' Prompt user for task names, start dates, and durations
    Set tNameRng = Application.InputBox("Select task names range", xTitleId, Type:=8)
    Set startRng = Application.InputBox("Select start dates range", xTitleId, Type:=8)
    Set durRng = Application.InputBox("Select durations range", xTitleId, Type:=8)

    ' Add chart sheet
    Set chartSheet = Worksheets.Add
    chartSheet.Name = "GanttChartAuto"

    ' Add stacked bar chart
    Set ch = chartSheet.ChartObjects.Add(Left:=100, Width:=500, Top:=100, Height:=400)
    ch.Chart.ChartType = xlBarStacked

    ' Add Start Date series
    ch.Chart.SeriesCollection.NewSeries
    ch.Chart.SeriesCollection(1).Name = "Start Date"
    ch.Chart.SeriesCollection(1).Values = startRng
    ch.Chart.SeriesCollection(1).XValues = tNameRng

    ' Add Duration series
    ch.Chart.SeriesCollection.NewSeries
    ch.Chart.SeriesCollection(2).Name = "Duration"
    ch.Chart.SeriesCollection(2).Values = durRng
    ch.Chart.SeriesCollection(2).XValues = tNameRng

    ' Format categories in reverse order
    ch.Chart.Axes(xlCategory).ReversePlotOrder = True

    ' Hide Start Date series
    With ch.Chart.SeriesCollection(1).Format.Fill
        .Visible = msoFalse
    End With

    ' Format Duration series with solid color
    With ch.Chart.SeriesCollection(2).Format.Fill
        .Visible = msoTrue
        .ForeColor.RGB = RGB(255, 153, 51) ' Orange
    End With

    ' Adjust axis minimum based on start date
    Dim minDate As Double
    minDate = Application.WorksheetFunction.Min(startRng)
    ch.Chart.Axes(xlValue).MinimumScale = minDate
End Sub
2. Execute the macro by clicking the ![]() Run button or using F5. Follow the pop-up prompts to select your task names range, start dates range, and duration range (typically three adjacent columns as set up in previous sections). The macro creates a new worksheet with a formatted Gantt chart based on your selections.
Run button or using F5. Follow the pop-up prompts to select your task names range, start dates range, and duration range (typically three adjacent columns as set up in previous sections). The macro creates a new worksheet with a formatted Gantt chart based on your selections.
More relative chart articles:
- Create A Bar Chart Overlaying Another Bar Chart In Excel
- When we create a clustered bar or column chart with two data series, the two data series bars will be shown side by side. But, sometimes, we need to use the overlay or overlapped bar chart to compare the two data series more clearly. In this article, I will talk about how to create an overlapped bar chart in Excel.
- Create A Step Chart In Excel
- A step chart is used to show the changes happened at irregular intervals, it is an extended version of a line chart. But, there is no direct way to create it in Excel. This article, I will talk about how to create a step chart step by step in Excel worksheet.
- Highlight Max And Min Data Points In A Chart
- If you have a column chart which you want to highlight the highest or smallest data points with different colors to outstand them as following screenshot shown. How could you identify the highest and smallest values and then highlight the data points in the chart quickly?
- Create Progress Bar Chart In Excel
- In Excel, progress bar chart can help you to monitor progress towards a target as following screenshot shown. But, how could you create a progress bar chart in Excel worksheet?
Best Office Productivity Tools
Supercharge Your Excel Skills with Kutools for Excel, and Experience Efficiency Like Never Before. Kutools for Excel Offers Over 300 Advanced Features to Boost Productivity and Save Time. Click Here to Get The Feature You Need The Most...
Office Tab Brings Tabbed interface to Office, and Make Your Work Much Easier
- Enable tabbed editing and reading in Word, Excel, PowerPoint, Publisher, Access, Visio and Project.
- Open and create multiple documents in new tabs of the same window, rather than in new windows.
- Increases your productivity by 50%, and reduces hundreds of mouse clicks for you every day!
All Kutools add-ins. One installer
Kutools for Office suite bundles add-ins for Excel, Word, Outlook & PowerPoint plus Office Tab Pro, which is ideal for teams working across Office apps.
- All-in-one suite — Excel, Word, Outlook & PowerPoint add-ins + Office Tab Pro
- One installer, one license — set up in minutes (MSI-ready)
- Works better together — streamlined productivity across Office apps
- 30-day full-featured trial — no registration, no credit card
- Best value — save vs buying individual add-in