How to create a step chart in Excel?
A step chart is used to show the changes happened at irregular intervals, it is an extended version of a line chart,and it uses vertical and horizontal lines to connect the data points as following screesnhot shown. But, there is no direct way to create it in Excel. This article, I will talk about how to create a step chart step by step in Excel worksheet.

Create a step chart based on date column in Excel
Create a step chart based on year column in Excel
Create a step chart based on date or year column with a simple feature
Create a step chart based on date column in Excel
For example, you have a range of data as shown in the screenshot below, to create a step chart, please do as this:

1. First, you should create the chart data, please copy the date cells from A3 to A12, and paste them into another column, column E as following screenshot shown:

2. Then go on copying the total order cells from B2 to B11, and paste them into column F, see screenshot:

3. After that, copy all the original data table and paste them below the new range you have just created, see screenshot:

4. Your data has been created, now, please select the new data range, and then click Insert > Insert Line or Area Chart > 2-D Line chart, see screenshot:

5. And now, your step chart has been created successfully, see screenshot:


Unlock Excel Magic with Kutools AI
- Smart Execution: Perform cell operations, analyze data, and create charts—all driven by simple commands.
- Custom Formulas: Generate tailored formulas to streamline your workflows.
- VBA Coding: Write and implement VBA code effortlessly.
- Formula Interpretation: Understand complex formulas with ease.
- Text Translation: Break language barriers within your spreadsheets.
Create a step chart based on year column in Excel
If your data is year column instead of date column, the above steps may not work well, the following steps can do you a favor.
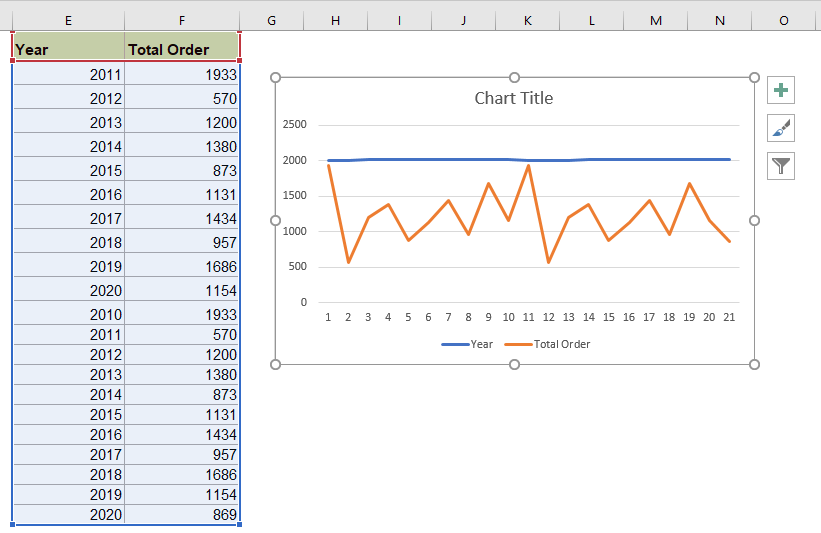
1. Create the chart data as above step1 – step3, see screenshot:

2. Then insert the line chart by clicking Insert > Insert Line or Area Chart > 2-D Line chart, and you will get the below chart:
3. Select the chart, and in the Chart Tools tab, click Design > Select Data, see screenshot:

4. In the Select Data Source dialog box, select the Year header, and click Remove button to delete this data point in Legend Entries (Series) section, see screenshot:

5. Go on clicking Edit button from the Horizontal(Category) Axis Labels option, see screenshot:

6. In the popped-out Axis Labels dialog box, select the Year column data except header from the new data range as following screenshot shown,

7. Then click OK > OK to close the dialogs, you will get the following chart, and then right-click the horizontal axis and choose Format Axis from the context menu, see screenshot:

8. In the opened Format Axis pane, under the Axis Options icon, check Date axis option in the Axis Type section, and now, the step chart has been created completely, see screenshot:

Create a step chart based on date or year column with a simple feature
If you have Kutools for Excel, with its Step Chart feature, you can create a step chart based on date or year column as you need quickly and easily.
After installing Kutools for Excel, please do as this:
1. Click Kutools > Charts > Difference Comparison > Step Chart, see screenshot:

2. In the Step Chart dialog box, select the horizontal axis labels and series values from the original data,see screenshot:

3. Then, click Ok button, and the step chart has been created at once, see screenshot:

More relative chart articles:
- Create A Bar Chart Overlaying Another Bar Chart In Excel
- When we create a clustered bar or column chart with two data series, the two data series bars will be shown side by side. But, sometimes, we need to use the overlay or overlapped bar chart to compare the two data series more clearly. In this article, I will talk about how to create an overlapped bar chart in Excel.
- Create Gantt Chart In Excel
- When you need to display your timeline of the project management in Excel, the Gantt chart can help you. Most of users may be known that the Gantt chart is a horizontal bar chart which is often used in project management applications, and from it you can view the timelines of each project managements visually and intuitively.
- Highlight Max And Min Data Points In A Chart
- If you have a column chart which you want to highlight the highest or smallest data points with different colors to outstand them as following screenshot shown. How could you identify the highest and smallest values and then highlight the data points in the chart quickly?
- Create Progress Bar Chart In Excel
- In Excel, progress bar chart can help you to monitor progress towards a target as following screenshot shown. But, how could you create a progress bar chart in Excel worksheet?
Best Office Productivity Tools
Supercharge Your Excel Skills with Kutools for Excel, and Experience Efficiency Like Never Before. Kutools for Excel Offers Over 300 Advanced Features to Boost Productivity and Save Time. Click Here to Get The Feature You Need The Most...
Office Tab Brings Tabbed interface to Office, and Make Your Work Much Easier
- Enable tabbed editing and reading in Word, Excel, PowerPoint, Publisher, Access, Visio and Project.
- Open and create multiple documents in new tabs of the same window, rather than in new windows.
- Increases your productivity by 50%, and reduces hundreds of mouse clicks for you every day!
All Kutools add-ins. One installer
Kutools for Office suite bundles add-ins for Excel, Word, Outlook & PowerPoint plus Office Tab Pro, which is ideal for teams working across Office apps.
- All-in-one suite — Excel, Word, Outlook & PowerPoint add-ins + Office Tab Pro
- One installer, one license — set up in minutes (MSI-ready)
- Works better together — streamlined productivity across Office apps
- 30-day full-featured trial — no registration, no credit card
- Best value — save vs buying individual add-in