How to create a half pie chart in Excel?
Sometimes, when you have a data range that includes a total value, inserting a pie chart may result in one half of the chart representing the "Total" series, while the other half displays the remaining point values, as shown in the left screenshot below. However, you might prefer to create a half pie chart that excludes the "Total" series, as illustrated in right screenshot below. Here's how to achieve this in Excel.


Clicks to create a half pie chart or semi-circular ring chart by a handy tool
 Create a half pie chart
1. Select all the data range and click Insert > Insert Pie or Dounughnut Chart > Pie. See screenshot:

2. Click at the Legend Entry of Total, and then click it again to select it, then remove the Legend Entry of Total, see screenshots: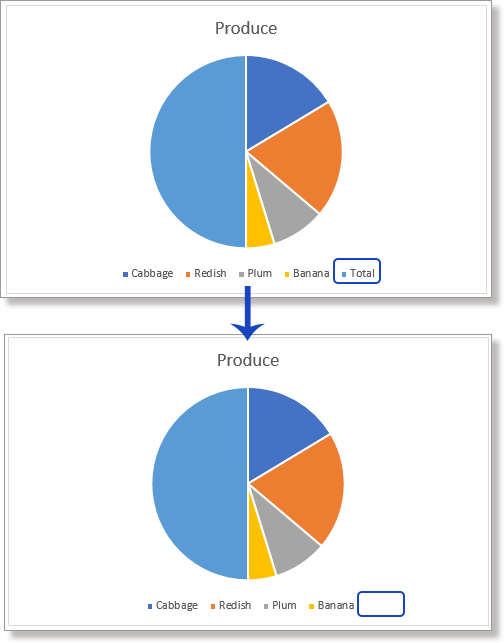
3. Click at the “Total” half pie, then click it again to select this half pie. Then right click to show the Mini toolbar, then click the arrow beside Fill, and choose No Fill to make the Total series look transparent. See screenshot:

4. Click the arrow of the Shape Outline, and select No Outline in the list. See screenshot:

Note: In Excel 2007, you can hide the half pie of Series “Total” with following steps:
(1) Right click the half pie, and select Format Data Point from the context menu;
(2) In the coming Format Data Point dialog box, click the Fill in left bar, and check the No Fill;
(3) Click the Border Color in the left bar, and check the No line;
(4) Click the Close button.
Then the whole pie become a half pie. Now you can rotate it if you need.
Optional: Right-click the pie and select Format Data Series, then specify the angle you need in the pane that appears.


Clicks to create a half pie chart or semi-circular ring chart by a handy tool
Kutools for Excel’s Half Pie Chart feature create a half pie chart or semi-circular ring chart with several clicks which will save much time for you in daily creating chart.
Kutools for Excel’s Charts group including dozens of smart and good-look charts which not only enhance your working efficiency, but also make your chart report out of ordinary.
1. Select the data range excluding total value (with Half Pie Chart, it does not need to calculate the total value before), click Kutools > Charts > Category Comparison > Half Pie Chart.
2. In the Half Pie Chart dialog, check Half -circle Pie Chart or Semi-circular Ring Chart options in Chart Type section, then go to Select Data section to check the axis labels and series values ranges. Click OK.
Then the chart will be created.
Kutools for Excel - Supercharge Excel with over 300 essential tools, making your work faster and easier, and take advantage of AI features for smarter data processing and productivity. Get It Now
Related Articles:
Best Office Productivity Tools
Supercharge Your Excel Skills with Kutools for Excel, and Experience Efficiency Like Never Before. Kutools for Excel Offers Over 300 Advanced Features to Boost Productivity and Save Time. Click Here to Get The Feature You Need The Most...
Office Tab Brings Tabbed interface to Office, and Make Your Work Much Easier
- Enable tabbed editing and reading in Word, Excel, PowerPoint, Publisher, Access, Visio and Project.
- Open and create multiple documents in new tabs of the same window, rather than in new windows.
- Increases your productivity by 50%, and reduces hundreds of mouse clicks for you every day!
All Kutools add-ins. One installer
Kutools for Office suite bundles add-ins for Excel, Word, Outlook & PowerPoint plus Office Tab Pro, which is ideal for teams working across Office apps.
- All-in-one suite — Excel, Word, Outlook & PowerPoint add-ins + Office Tab Pro
- One installer, one license — set up in minutes (MSI-ready)
- Works better together — streamlined productivity across Office apps
- 30-day full-featured trial — no registration, no credit card
- Best value — save vs buying individual add-in