How to group by age in pivot table?
When working with survey or questionnaire data in Excel, it’s common to analyze results based on age groups rather than individual ages. Grouping by age ranges can help uncover meaningful trends, support clearer data presentations, and make your reports easier to interpret. Using a pivot table allows you to organize large numbers of responses rapidly and summarize them into specific age categories that match your reporting needs. This article provides practical guidance for grouping by age using a pivot table and introduces several alternatives, including formula-based helper columns for customized grouping.
Excel formula method: Use helper column for flexible age grouping
 Group by age in pivot table
Suppose you have a dataset containing the names, ages, and responses of survey participants. For example, your worksheet may look like the screenshot below, where each row records an individual's name, age, and their selected option or answer. Your goal is to count and analyze the results based on broader age ranges instead of individual age values, enabling age-based comparison within your report.

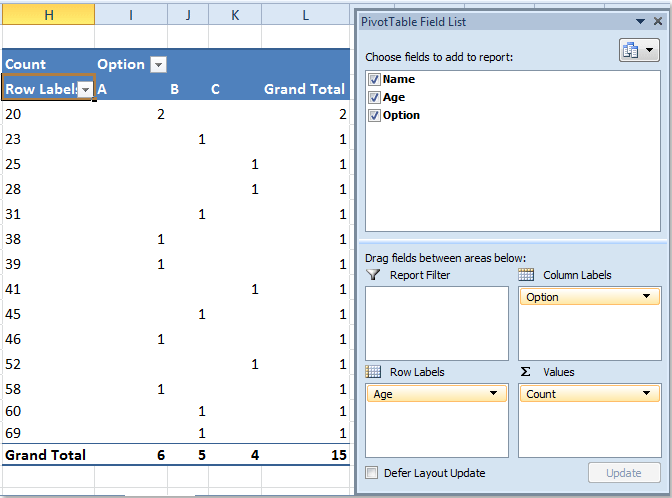
1. Select any cell within your data range and insert a pivot table. In the dialog box, confirm your data range and choose where you’d like to place the pivot table. In the PivotTable Field List, drag the Age field into the Rows area, the Option field into the Columns area (or Values if comparing counts per option), and the Name field into the Values area (by default it will count names, which represents the number of people). Your base pivot table should resemble the screenshot below:
2. To group ages into defined intervals, right-click any cell in the Age field (in the Row Labels area of your pivot table), and select Group from the context menu as shown in the screenshot below. This brings up the grouping options, allowing you to quickly set up your preferred age brackets.

3. In the Grouping dialog box, use the By field to specify the size of each age group interval. For example, entering 10 will group ages as1–10,11–20,21–30, and so on. By default, the Starting at and Ending at ages are detected from your data, but you can adjust these to fit nonstandard group boundaries if needed. Note that grouping requires all data to be recognized as numbers; if you see an error or the Group option is unavailable, check for blank cells or non-numeric values in the Age column.

4. Click OK to close the dialog box. The pivot table now displays data aggregated by age group intervals instead of individual ages, as shown below. This grouped view is ideal for reporting, highlighting trends, or comparing responses across different age segments.

This method is straightforward and works well when your grouping needs are simple and your age data does not contain gaps or non-numeric values. However, the built-in grouping feature is limited to equal intervals and may not work in cases where you wish to define custom age categories such as "Under 18", "18-25", "26-40", or "Over 40". In those cases, consider using a helper column with formulas, as explained below.
Excel formula method: Use helper column for flexible age grouping
If you require more control or wish to group ages into uneven or custom ranges (such as "<18", "18-25", "26-40", "Over 40"), using an additional helper column is a practical solution. This method is suitable in scenarios where the standard interval grouping does not meet your classification needs, or you want to label groups with descriptive text. By defining your own grouping formula in an auxiliary column, your pivot table will be able to summarize according to these custom-defined age bands.
Advantages: Enables fully customized group ranges and labels. Disadvantages: Requires formula skills and an extra step for setup.
1. Add a new column in your worksheet, for example name it Age Group.
2. In the first cell of the Age Group column (assuming your data starts from row2 and age values are in column B), enter the following formula to categorize ages into custom groups:
=IF(B2<18,"Under18",IF(B2<=25,"18-25",IF(B2<=40,"26-40","Over40")))This example formula assigns ages below18 to "Under 18", ages from 18 to 25 to "18-25", ages from 26 to 40 to "26-40", and ages above 40 to "Over40". You can modify the boundaries or labels to suit your needs.
3. Press Enter, then copy the formula down to the rest of the rows in your dataset. You can do this by dragging the fill handle at the bottom-right corner of the formula cell.
4. Now, create a pivot table based on your expanded data (including the Age Group column).
5. Drag Age Group to the Rows area of the pivot table, Option to the Columns area, and Name to the Values area (or other summary field as needed). Your pivot table will summarize data by your custom age categories.
Troubleshooting and Suggestions:
- If the Group feature is greyed out in your pivot table, check for empty or non-numeric values in the Age column. Clear any blanks or text and try again.
- For large datasets or frequent updates, consider using the helper column method for easier maintenance and to avoid repeatedly regrouping.
- Before creating your pivot table, ensure data is cleaned and formatted consistently to prevent errors during grouping. Double-check age range boundaries in either grouping dialog or helper formulas.
- When labeling groups, use clear and descriptive names for better report readability. Avoid overlapping age criteria in formulas to ensure logical grouping.
Related articles:
How to group by week in pivot table?
How to repeat row labels for group in pivot table?
Best Office Productivity Tools
Supercharge Your Excel Skills with Kutools for Excel, and Experience Efficiency Like Never Before. Kutools for Excel Offers Over 300 Advanced Features to Boost Productivity and Save Time. Click Here to Get The Feature You Need The Most...
Office Tab Brings Tabbed interface to Office, and Make Your Work Much Easier
- Enable tabbed editing and reading in Word, Excel, PowerPoint, Publisher, Access, Visio and Project.
- Open and create multiple documents in new tabs of the same window, rather than in new windows.
- Increases your productivity by 50%, and reduces hundreds of mouse clicks for you every day!
All Kutools add-ins. One installer
Kutools for Office suite bundles add-ins for Excel, Word, Outlook & PowerPoint plus Office Tab Pro, which is ideal for teams working across Office apps.
- All-in-one suite — Excel, Word, Outlook & PowerPoint add-ins + Office Tab Pro
- One installer, one license — set up in minutes (MSI-ready)
- Works better together — streamlined productivity across Office apps
- 30-day full-featured trial — no registration, no credit card
- Best value — save vs buying individual add-in