How to add leader lines to doughnut chart in Excel?
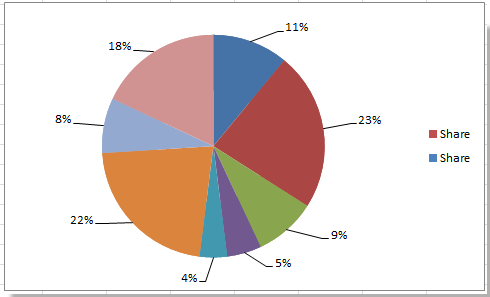
Sometimes, when you show the data labels in a doughnut chart, you want to add the leader lines to the labels at the meanwhile just as the below screenshot shown. However, in Excel, the doughnut chart doesn’t support the leader lines. But here I can tell you a tip to add leader lines to doughnut chart in Excel.

Add leader lines to doughnut chart
 Add leader lines to doughnut chart

As we know, the pie chart has leader lines, so you just need to combine the pie chart and doughnut chart together in Excel.
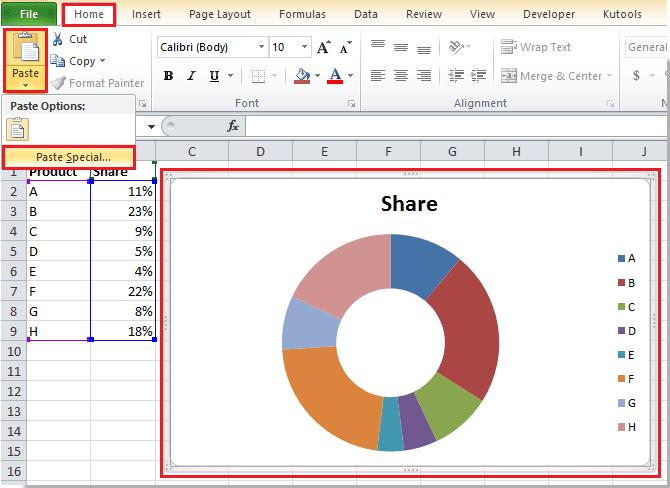
1. Select data and click Insert > Other Charts > Doughnut.

In Excel 2013, click Insert > Insert Pie or Doughnut Chart > Doughnut.
2. Select your original data again, and copy it by pressing Ctrl + C simultaneously, and then click at the inserted doughnut chart, then go to click Home > Paste > Paste Special. See screenshot:
3. In the Paste Special dialog, check New series in Add cells as section, then both check Series Names in First Row and Categories (X Labels) in First Column check boxes.

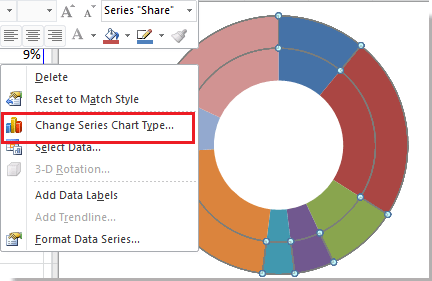
4. Click OK to close dialog. Then select the outside doughnut only, and right click to select Change Series Chart Type from context menu. See screenshot:
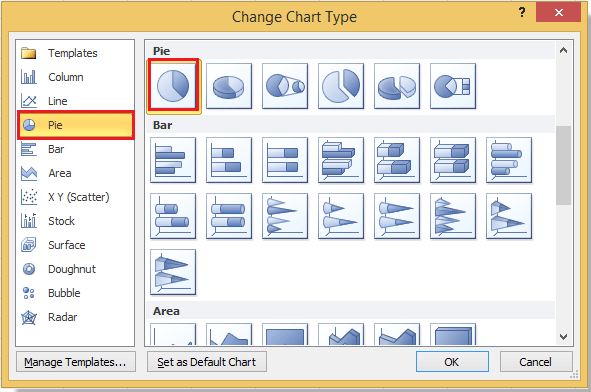
5. In the Change Chart Type dialog, click Pie > Pie. See screenshot:
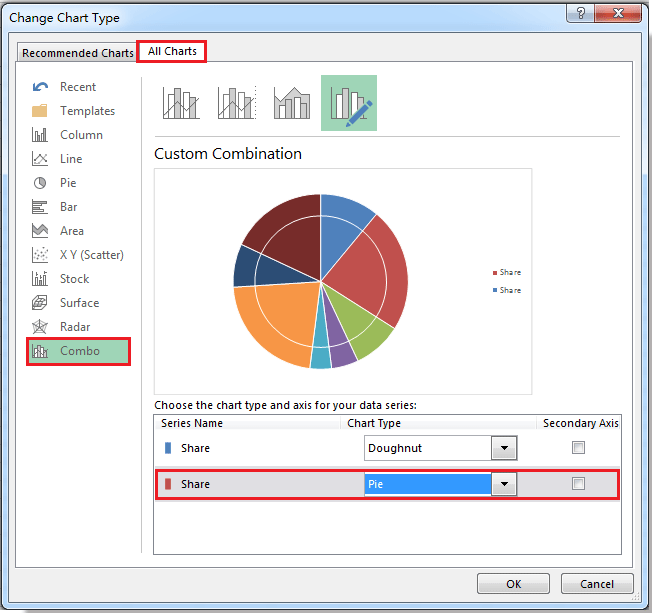
In Excel 2013, under All Charts tab, click Combo in the left pane, and then select one series and change its chart type to pie. See screenshot:
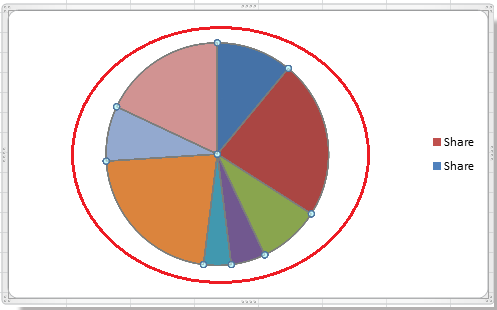
6. Click OK. And select the pie chart only, then right click to select Add Data Labels from context menu. See screenshots:
 |
 |
7. Now you can see the data labels are added in the pie chart, just drag the labels outside the pie, you can see the leader lines shown.
8. Now select the pie only, and right click to select Format Data Series from context menu.

9. In Format Data Series dialog, click Fill > No fill, and then click Border Line > No line, at last click the Close button to exit this dialog See screenshots:
 |
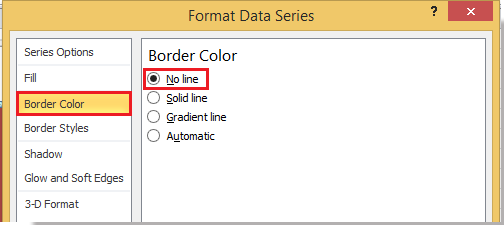 |
In Excel 2013, in Format Data Series pane, click Fill & Line tab, and check No fill and No line.
10. Now remove legends you do not need. And the doughnut chart with leader lines is created.

If you want to change the leader lines color, you can read this article How to format leader lines.
Relative Articles:
Best Office Productivity Tools
Supercharge Your Excel Skills with Kutools for Excel, and Experience Efficiency Like Never Before. Kutools for Excel Offers Over 300 Advanced Features to Boost Productivity and Save Time. Click Here to Get The Feature You Need The Most...
")
Office Tab Brings Tabbed interface to Office, and Make Your Work Much Easier
- Enable tabbed editing and reading in Word, Excel, PowerPoint, Publisher, Access, Visio and Project.
- Open and create multiple documents in new tabs of the same window, rather than in new windows.
- Increases your productivity by 50%, and reduces hundreds of mouse clicks for you every day!
")