How to calculate moving average in Excel?
When dealing with data that fluctuates over time, such as stock prices, weather patterns, or sales trends, it's crucial to discern the underlying patterns beneath the surface of volatile or chaotic data sets. This is where the concept of a moving average becomes invaluable. A moving average provides a clear view of the trend in data by smoothing out short-term fluctuations and highlighting longer-term trends or cycles.
| In this tutorial, we'll explore methods to calculate the moving average in Excel, along with guidance on adding a moving average trendline to an existing chart. Let's get started and master these techniques. |

What is moving average?
A moving average, often referred to as a rolling or moving mean, or sometimes a rolling or running average, is a statistical method for analyzing a series of data points. This is done by computing the average of different, overlapping subsets of the full dataset.
This technique is dynamic, meaning it's continually updated as new data comes in. This makes it particularly effective for reducing the impact of short-term variations or anomalies in data. For instance, consider a series of 10 numbers. If we choose a subset size of 3, the moving average process starts with calculating the average of the first three numbers. Then, the subset moves forward by one position – the first number is dropped, and the fourth number is included, forming a new group of three for the next average calculation. This shifting and averaging continue, one number at a time, until the end of the series is reached.
The moving average is widely used in various fields, including statistics, financial analysis, and weather forecasting to discern underlying trends over time.
Calculate moving average in Excel
In this section, we'll explore two effective methods to calculate moving averages in Excel. Step by step, we'll guide you through each process, ensuring that you can efficiently apply these techniques to your data analysis tasks.
Calculate moving average in Excel using the AVERAGE function
The "AVERAGE function" in Excel is a straightforward way to calculate the moving average. Imagine you have a table containing data for 8 periods, if you want to calculate a moving average for 3 periods, here's a step-by-step guide:
- Click on the cell where you want to display the first moving average. In our example, this would be cell C4, as we're calculating a 3-period moving average.
- Enter the AVERAGE formula:
=AVERAGE(B2:B4)Tip: This formula calculates the average of the first three data points (B2, B3, B4). - Click on cell C4, and drag its fill handle down to the cell where you want the last moving average to appear.


Notes:
- For a cleaner display of your moving average results, select the cells and click the "Decrease Decimal" button in the "Number" group on the "Home" tab to reduce decimal places.

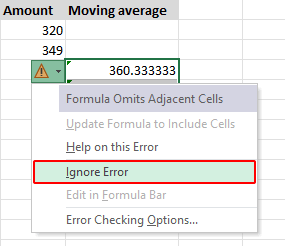
- After applying the formula, you might observe a small green triangle in the top left corner of each cell. To remove this, select the cells with the formula, click on the yellow triangle with an exclamation mark that appears, and choose "Ignore Error".


Calculate moving average in Excel using the Data Analysis tool
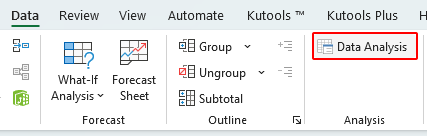
Excel's "Data Analysis" command offers a suite of tools for data analysis, including the "Moving Average" tool that can help you calculate the average for a specific data range and create a moving average chart easily.
Note: The "Data Analysis" command can be found in the Data tab. If you do not see it there, enable it by going to "File" > "Options" > "Add-ins". In the "Manage" box at the bottom, make sure "Excel Add-ins" is selected and click "Go". In the "Add-ins" dialog, check the box next to "Analysis ToolPak" and click "OK".
- Click "Data" > "Data Analysis".
- In the "Data Analysis" dialog, choose "Moving Average" and click "OK".
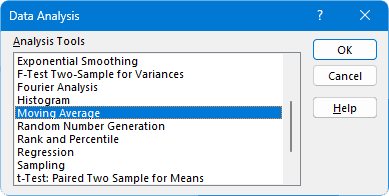
- In the "Moving Average" dialog box that appears, please:
- Input Range: Select the data range for the moving averages. For example, select range B2:B9.
- Interval: Enter the number of data points for each moving average. In our case, we enter 3 into it.
- Output Range: Choose where you want the moving averages results displayed, such as range C2:C9.
- Chart Output: Check this option if you want a graphical display.
- Click "OK".


Result
After clicking "OK", Excel will generate the moving averages in the specified output range. If the "Chart Output" option is selected, a corresponding chart will also be created.

Add a moving average trendline to an existing chart
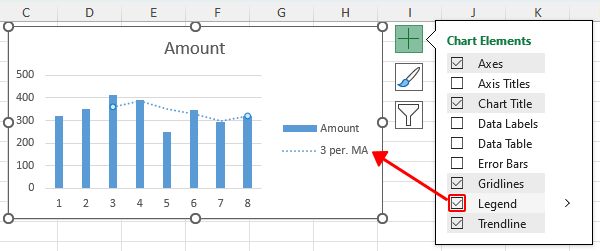
If you already have a chart in your Excel worksheet as shown below, you can easily add a moving average trendline to analyze trends.

- Click the chart to which you wish to add the trendline.
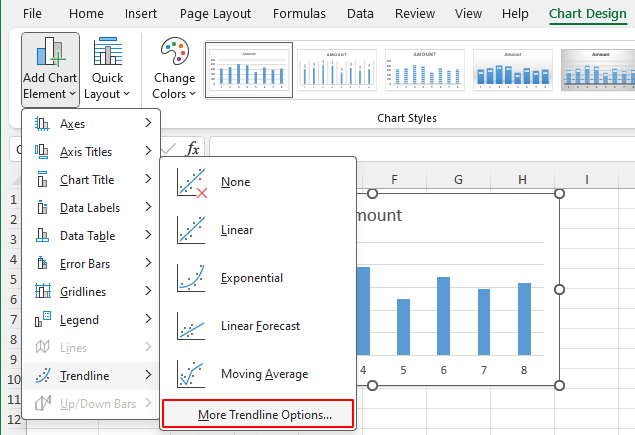
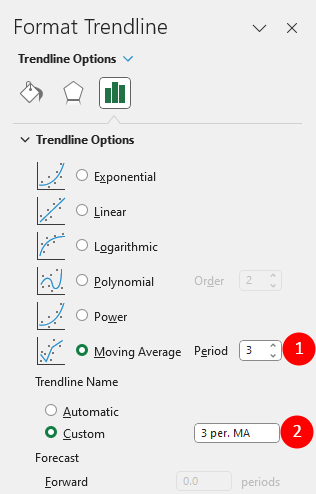
- Click "Chart Design" (or "Design" in earlier versions) > "Add Chart Element" > "Trendline" > "More Trendline Options".
 Quick Tip: If the default "2-period moving average" suits your needs, you can directly select "Chart Design" > "Add Chart Element" > "Trendline" > "Moving Average". This action will insert a trendline labeled as "2 per. Mov. Avg." by default.
 - When the "Format Trendline" pane opens on the right side of your worksheet:
- Choose the "Moving Average" option, and specify the moving average interval in the "Period" box.
- (Optional) To personalize the trendline name, select "Custom" and enter your preferred name.


Result
After these steps, the moving average trendline will be added to your chart, as illustrated below.

Advanced Chart Customization and Analysis:
- For more customization, use the "Fill & Line" or "Effects" tabs in the "Format Trendline" pane to experiment with different options like "line type", "color", and "width".

- To conduct a more in-depth analysis, add several moving average trendlines with different time intervals. For example, you can add 2-period (dark red) and 3-period (orange) moving average trendlines to compare how the trend changes over time.


Above is all the relevant content related to moving average in Excel. I hope you find the tutorial helpful. If you're looking to explore more Excel tips and tricks, please click here to access our extensive collection of over thousands of tutorials.
Video: Calculate moving average in Excel
The Best Office Productivity Tools
Kutools for Excel - Helps You To Stand Out From Crowd
Kutools for Excel Boasts Over 300 Features, Ensuring That What You Need is Just A Click Away...
Office Tab - Enable Tabbed Reading and Editing in Microsoft Office (include Excel)
- One second to switch between dozens of open documents!
- Reduce hundreds of mouse clicks for you every day, say goodbye to mouse hand.
- Increases your productivity by 50% when viewing and editing multiple documents.
- Brings Efficient Tabs to Office (include Excel), Just Like Chrome, Edge and Firefox.
Table of contents
- What is moving average?
- Calculate moving average in Excel
- Using the AVERAGE function
- Using the Data Analysis tool (Chart generation available)
- Add a moving average trendline to an existing chart
- Video: Calculate moving average in Excel
- Related articles
- The Best Office Productivity Tools
- Comments