How to compare two columns and highlight when found in another column?
When managing data in Excel, you often encounter situations where you need to identify values that appear in both of two different lists. For instance, if you maintain a worksheet with List A and List B, and you want to visually highlight those entries from List A that also exist in List B, it can help you spot overlaps, duplicates, or items that require further processing. This type of comparison can be useful in a variety of scenarios, such as validating inventory, checking for repeated entries, or cross-referencing records between datasets. This article introduces several practical techniques for comparing two columns and highlighting the shared values found in another column in Excel.

➤ Highlight cells if duplicate in another column with Kutools for Excel
➤ VBA Code - Use VBA to loop through columns and highlight matching values programmatically
➤ Excel Formula - Use COUNTIF formula to create a helper column indicating duplicates
Highlight cells if duplicate in another column with Conditional Formatting
In Excel, Conditional Formatting provides a fast, flexible way to highlight values that appear in both columns. This is especially useful when you want to visually identify matches at a glance without altering your underlying data. Follow these steps:
1. Select the cells in Column A where you want to highlight entries that also exist in Column C. Make sure you select the correct data range without extra blank cells, as blanks may be highlighted if they also appear in both columns.
2. Go to the Home tab, click Conditional Formatting, and choose New Rule. In the New Formatting Rule dialog, select Use a formula to determine which cells to format. In the box labeled Format values where this formula is true, enter: =MATCH(A2,$C$2:$C$12,0) This formula checks whether each value in Column A can be found within the specified range in Column C. See screenshot:

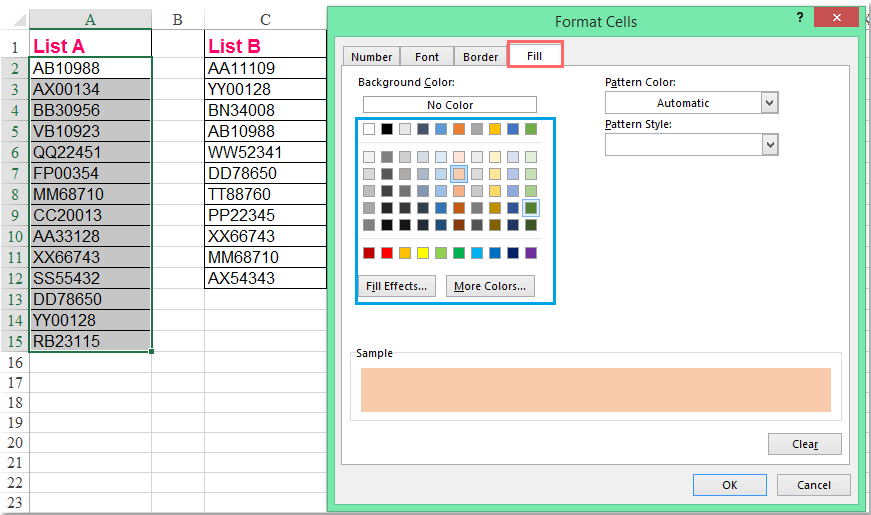
3. Click Format to open the Format Cells dialog. On the Fill tab, choose a highlight color. Confirm and close the dialog with OK.
4. Click OK to apply the rule. Any value in List A that also exists in List B will be highlighted. Result example:

Conditional Formatting works well for quick visual analysis. For very large datasets, multiple formula-based rules can slow calculation and scrolling; note that this method only highlights matches and does not extract or filter them.
Compare two columns and highlight cells if duplicate in another column
When you need to compare two columns and quickly highlight values that exist in both, the Kutools for ExcelSelect Same & Different Cells feature is a convenient choice. This is particularly suitable for users who want an intuitive interface and wish to avoid complex formulas or manual settings. By using Kutools, highlighting duplicates can be accomplished in just a few clicks, which is especially helpful when dealing with lengthy lists or repeated tasks. Download and free trial Kutools for Excel Now!

Highlight cells if duplicate in another column with Kutools for Excel
If you are not comfortable writing formulas or configuring conditional formatting rules, you can take advantage of the easy-to-use Kutools for Excel add-in. Its Select Same & Different Cells utility simplifies the process of comparing two columns and highlighting matching values, making it ideal for users at any skill level.
After installing Kutools for Excel, please follow these steps:
1. Go to the Kutools tab, then click Select > Select Same & Different Cells to open the dialog. This option is straightforward to find, and the feature is accessible without needing to write or adjust formulas.

2. In the Select Same & Different Cells dialog, perform the following actions:
(1.) Set your comparison ranges by selecting the two lists you wish to compare in the Find values in and According to boxes;
(2.) Under Based on, choose Each row to ensure the comparison goes through each item;
(3.) In the Find section, select Same Values to focus on common items between the two columns;
(4.) Specify your preferred highlight color for background or font using the Processing of results option. This step makes it clear which values are matches after the process completes.

3. Once everything is configured, click the Ok button. Kutools will process your selection and a prompt will indicate how many matching cells were found and highlighted. Click OK in the prompt to close it. Duplicate values in List A will now be clearly selected and highlighted, making review and further analysis simple.

Note: If you want to highlight duplicates in List B instead, switch the comparison ranges in the dialog. This flexibility allows you to highlight matches in either list as needed.
Download and free trial Kutools for Excel Now !
The Kutools solution is advantageous for users who want consistency and efficiency. However, please note it is an additional Excel add-in, and may not be available in all environments, such as strict corporate settings or on shared public computers.
VBA Code - Use VBA to loop through columns and highlight matching values programmatically
If you frequently need to compare columns or want to fully automate the highlighting process, using VBA is an effective and repeatable solution. With VBA, you can precisely control the comparison, highlight matched values in-place, and customize the behavior for any consistent data structure in your worksheets. This approach is suited for more advanced users or when you need to perform such tasks on a regular basis.
1. Open the Excel workbook, then go to the Developer tab. Click Visual Basic to open the Microsoft Visual Basic for Applications window. In the VBA Project window, click Insert > Module to create a new module. Copy and paste the following code into the module:
Sub HighlightMatchingValues()
    Dim rngA As Range
    Dim rngB As Range
    Dim cellA As Range
    Dim matchCell As Range
    Dim xTitleId As String
    Dim matchFound As Boolean

    On Error Resume Next
    xTitleId = "KutoolsforExcel"

    Set rngA = Application.InputBox("Select the range for List A", xTitleId, Type:=8)
    Set rngB = Application.InputBox("Select the range for List B", xTitleId, Type:=8)

    Application.ScreenUpdating = False

    For Each cellA In rngA
        matchFound = False
        For Each matchCell In rngB
            If cellA.Value = matchCell.Value And cellA.Value <> "" Then
                matchFound = True
                Exit For
            End If
        Next matchCell

        If matchFound Then
            cellA.Interior.Color = RGB(255, 255, 0) 'Highlight with yellow
        End If
    Next cellA

    Application.ScreenUpdating = True

    MsgBox "Matching values in List A have been highlighted.", vbInformation, "KutoolsforExcel"
End Sub
2. To execute the code, click inside the module and then press F5 or click the Run button ![]() . When prompted, select the range for List A, then select the range for List B. The macro will automatically highlight all values in List A that are also present in List B, using a yellow fill color for easy visibility.
. When prompted, select the range for List A, then select the range for List B. The macro will automatically highlight all values in List A that are also present in List B, using a yellow fill color for easy visibility.
Tips and considerations: Use this approach when you have large lists, require repeat automation, or need more customization. It's important to save your work first and ensure that any cells already containing fill colors are considered, as the macro will overwrite existing cell backgrounds of matches. If you want to reverse the comparison or change the highlight color, edit the code accordingly. The macro prompts guide you through selection, reducing the risk of range selection errors.
If you encounter errors, verify the data ranges selected do not include merged cells or headers, and that values are comparable (numbers/text and no hidden special characters).
Excel Formula - Use COUNTIF formula to create a helper column indicating duplicates
Besides direct highlighting, you can also leverage helper columns with formulas to identify duplicates and then manually or conditionally highlight them. This method is straightforward, especially when you need to mark matches explicitly before applying any formatting. It's practical for cases where you want a permanent indicator column for downstream analysis or automated workflows.
1. In a blank column next to your List A (for example, in cell B2), enter the following formula:
=IF(COUNTIF($C$2:$C$12,A2)>0,"Duplicate","")This formula checks if the value in A2 is found anywhere in C2:C12. If it is, the formula returns "Duplicate"; otherwise, it leaves the cell blank. You can edit cell references to match the actual position and extent of your data lists.
2. Press Enter, then use the fill handle to drag the formula down alongside all rows in List A. This will populate the helper column to indicate which values appear in both columns.
3. (Optional) For clearer visualization, you can now use Conditional Formatting based on this helper column:
- Select the range in List A you wish to highlight.
- Go to Home > Conditional Formatting > New Rule.
- Choose Use a formula to determine which cells to format and enter a formula such as =$B2="Duplicate" (assuming B is your helper column).
- Set your desired highlight format, then confirm to apply the rule.
This approach provides transparency of the comparison, is flexible for further processing or filtering, and is suitable for data audit trails. Note that you need to maintain the helper column for ongoing comparisons, and additional columns may slightly increase worksheet complexity.
Related articles:
How to check / find if value exists in another column?
How to compare two columns and list differences in Excel?
How to highlight cells if not in another column in Excel?
Best Office Productivity Tools
Supercharge Your Excel Skills with Kutools for Excel, and Experience Efficiency Like Never Before. Kutools for Excel Offers Over 300 Advanced Features to Boost Productivity and Save Time. Click Here to Get The Feature You Need The Most...
Office Tab Brings Tabbed interface to Office, and Make Your Work Much Easier
- Enable tabbed editing and reading in Word, Excel, PowerPoint, Publisher, Access, Visio and Project.
- Open and create multiple documents in new tabs of the same window, rather than in new windows.
- Increases your productivity by 50%, and reduces hundreds of mouse clicks for you every day!
All Kutools add-ins. One installer
Kutools for Office suite bundles add-ins for Excel, Word, Outlook & PowerPoint plus Office Tab Pro, which is ideal for teams working across Office apps.
- All-in-one suite — Excel, Word, Outlook & PowerPoint add-ins + Office Tab Pro
- One installer, one license — set up in minutes (MSI-ready)
- Works better together — streamlined productivity across Office apps
- 30-day full-featured trial — no registration, no credit card
- Best value — save vs buying individual add-in