How to set absolute position of a chart in Excel?
Normally, we may place a chart at random when creating or moving it in Excel. However, in some special cases, you may want to place the chart at a precise position, such as begin at Cell A1, stay in Range A1:D5, or else. Here, I will introduce a VBA to set absolute position of a chart in Excel.
- Apply VBA to set absolute position of a chart in Excel
- An amazing tool to set absolute position of a chart in Excel
Apply VBA to set absolute position of a chart in Excel
For example, you have created a chart and placed it at random in the worksheet as below screenshot shown. Now I will introduce a VBA to quickly move the chart to a precise and absolute position easily.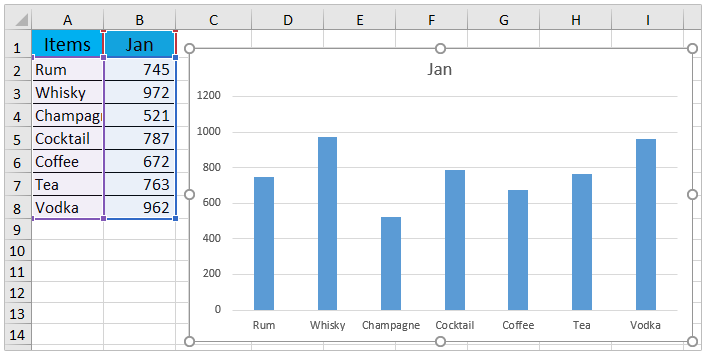
1. Select the chart you will set absolution position for, and press Alt + F11 keys to open the Microsoft Visual Basic for Applications window.
2. Click Insert > Module, and paste below VBA into the new module window.
VBA: Set absolution position of a chart in Excel
Sub Test()
Dim xRg As Range
Dim xChart As ChartObject
Set xRg = Range("D1:J13")
Set xChart = ActiveSheet.ChartObjects(1)
With xChart
.Top = xRg(1).Top
.Left = xRg(1).Left
.Width = xRg.Width
.Height = xRg.Height
End With
End Sub
Note: In above code, Set xRg = Range("D1:J13") means move and place the chart into Range D1:J13. You can change the range as you need.
3. Press F5 key or click the Run button to run this VBA.
Now you will see the chart is moved to the precise position as you specified in the VBA. See screenshot:
An amazing tool to set absolute position of a chart in Excel
If you have Kutools for Excel installed, you can apply its amazing chart tool – Set Absolute Position of Chart to move and resize a chart to a specified range in Excel.
1. Select the chart that you will set to an absolute position, and click Kutools > Charts > Chart Tools > Set Absolute Position of Chart.
2. In the popping out dialog, specify the position that you will move the chart to, and click the Ok button.
Now the selected chart is moved to the specified position and resized to the specified range simultaneously. See screenshot:
Kutools for Excel - Supercharge Excel with over 300 essential tools, making your work faster and easier, and take advantage of AI features for smarter data processing and productivity. Get It Now
Related articles:
Best Office Productivity Tools
Supercharge Your Excel Skills with Kutools for Excel, and Experience Efficiency Like Never Before. Kutools for Excel Offers Over 300 Advanced Features to Boost Productivity and Save Time. Click Here to Get The Feature You Need The Most...
Office Tab Brings Tabbed interface to Office, and Make Your Work Much Easier
- Enable tabbed editing and reading in Word, Excel, PowerPoint, Publisher, Access, Visio and Project.
- Open and create multiple documents in new tabs of the same window, rather than in new windows.
- Increases your productivity by 50%, and reduces hundreds of mouse clicks for you every day!
All Kutools add-ins. One installer
Kutools for Office suite bundles add-ins for Excel, Word, Outlook & PowerPoint plus Office Tab Pro, which is ideal for teams working across Office apps.
- All-in-one suite — Excel, Word, Outlook & PowerPoint add-ins + Office Tab Pro
- One installer, one license — set up in minutes (MSI-ready)
- Works better together — streamlined productivity across Office apps
- 30-day full-featured trial — no registration, no credit card
- Best value — save vs buying individual add-in