How to move chart X axis below negative values/zero/bottom in Excel?
When negative data existing in source data, the chart X axis stays in the middle of chart. For good looking, some users may want to move the X axis below negative labels, below zero, or to the bottom in the chart in Excel. This article introduce two methods to help you solve it in Excel.
- Move X axis' labels below negative value/zero/bottom with formatting X axis in chart
- Move X axis and labels below negative value/zero/bottom with formatting Y axis in chart
- One click to move the X-axis to bottom with an amazing tool
Move X axis' labels below negative value/zero/bottom with formatting X axis in chart
Actually we can change the X axis labels' position in a chart in Excel easily. And you can do as follows:
1. Right click the X axis in the chart, and select the Format Axis from the right-clicking menu.
2. Go ahead based on your Microsoft Excel's version:
(1) In Excel 2013's Format Axis pane, expand the Labels on the Axis Options tab, click the Label Position box and select Low from the drop down list;
(2) In Excel 2007 and 2010's Format Axis dialog box, click Axis Options in left bar, click the Axis labels box and select Low from drop down list.
Tip: Kutools for Excel’s Auto Text utility can save a selected chart as an Auto Text, and you can reuse this chart at any time in any workbook by only one click.
Kutools for Excel - Supercharge Excel with over 300 essential tools, making your work faster and easier, and take advantage of AI features for smarter data processing and productivity. Get It Now

Move X axis and labels below negative value/zero/bottom with formatting Y axis in chart
In addition to changing X axis's label position, we can also move chart X axis below negative values and to the bottom with formatting the Y axis as follows:
1. Right click the Y axis and select the Format Axis from the right-clicking menu.
2. Go ahead based on your Microsoft Excel's version:
(1) In Excel 2013's Format Axis pane, go to the Axis Options tab, check the Axis value option in the Horizontal axis crosses section, and enter the minimum value of Y axis in the following box. In our example, we type -400 into the Axis value box.
(2) In Excel 2007 and 2010's Format Axis dialog box, click Axis Options in left bar, check Axis value option and type the minimum value of Y axis (-400 in our example) in following box.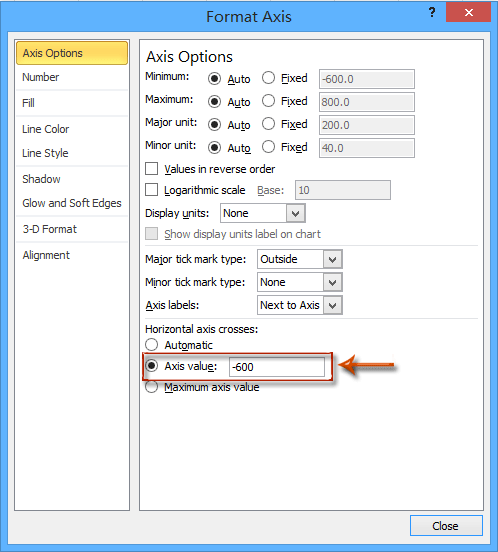
One click to move the X-axis to bottom with an amazing tool
Supposing you have created a cluster column chart as below screenshot shown. and you can one click to move its horizontal axis to the bottom by Move X-axis to Negative/Zero/Bottom tool of Kutools for Excel.
Kutools for Excel - Packed with over 300 essential tools for Excel. Make Excel tasks faster, easier, and more efficient. Download now!
Select the cluster column chart whose horizontal axis you will move, and click Kutools > Chart Tools > Move X-axis to Negative/Zero/Bottom.
Then the horizontal X axis is moved to the bottom of the cluster column chart immediately. See screenshot:
Demo: Move X axis' labels below negative value/zero/bottom in Excel
Related articles:
Best Office Productivity Tools
Supercharge Your Excel Skills with Kutools for Excel, and Experience Efficiency Like Never Before. Kutools for Excel Offers Over 300 Advanced Features to Boost Productivity and Save Time. Click Here to Get The Feature You Need The Most...
Office Tab Brings Tabbed interface to Office, and Make Your Work Much Easier
- Enable tabbed editing and reading in Word, Excel, PowerPoint, Publisher, Access, Visio and Project.
- Open and create multiple documents in new tabs of the same window, rather than in new windows.
- Increases your productivity by 50%, and reduces hundreds of mouse clicks for you every day!
All Kutools add-ins. One installer
Kutools for Office suite bundles add-ins for Excel, Word, Outlook & PowerPoint plus Office Tab Pro, which is ideal for teams working across Office apps.
- All-in-one suite — Excel, Word, Outlook & PowerPoint add-ins + Office Tab Pro
- One installer, one license — set up in minutes (MSI-ready)
- Works better together — streamlined productivity across Office apps
- 30-day full-featured trial — no registration, no credit card
- Best value — save vs buying individual add-in