How to add a note in an Excel chart?
When working with data visualizations in Excel, you may often need to add supplementary information to a chart that helps viewers better understand key points, highlight trends, or clarify specific data. For example, you might want to annotate critical values, explain chart changes, or simply leave a reminder for other Excel users. In this article, we'll introduce several practical methods to add custom notes to Excel charts, making your presentations and reports more informative and visually appealing.
Add a note in an Excel chart
Excel Formula - Link the text box (note) to a cell so the note updates automatically when the cell content changes
VBA Code - Automatically add or update notes in charts through macros for dynamic or batch processing
Add a note in an Excel chart
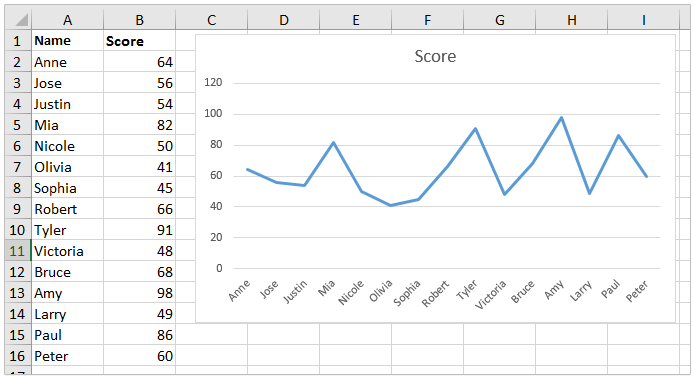
Suppose you have created a line chart as shown in the screenshot below and wish to add a custom note within the chart area. This is a common way to provide extra context directly on the visualization, making observations and commentary easily accessible to users viewing your report.
1. Click the chart to activate the Chart Tools. Then, navigate to Format > Text Box![]() within the Insert Shapes group. See screenshot below.
within the Insert Shapes group. See screenshot below.
Note: If you are working in Excel2010, please click Layout > Text Box under the Chart Tools tab for similar results.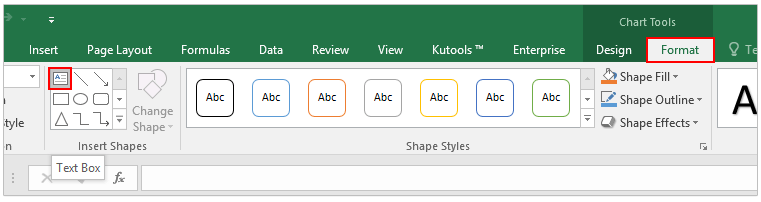
2. Draw a text box anywhere within the chart area by dragging with your mouse, as illustrated below. Then, type your desired note directly into the text box. This method allows you to add explanations, highlight results, or annotate specific sections of your chart for clearer communication.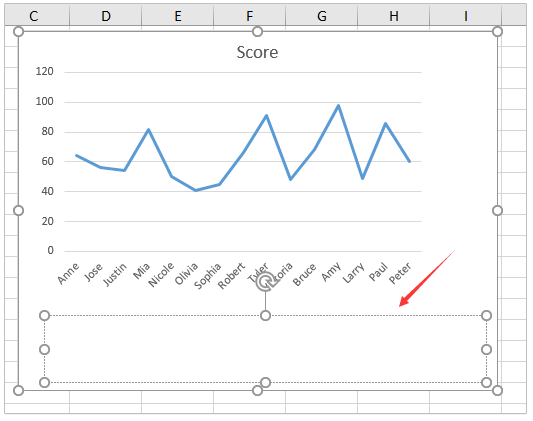
3. Customize the font and style of your note using the Font group on the Home tab. You can adjust font size, change font color, apply bold or italics, and other formatting options to make the note more prominent or align with your document’s theme.
Once you've formatted your note as needed, it will appear directly within the chart, as in the screenshot below. This solution is quick and works well when the note content will not change frequently.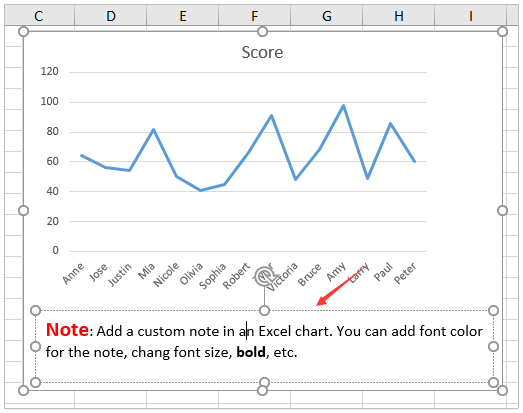
Applicable scenarios: Use this approach when you need a one-time or manual annotation in your chart and no dynamic update is required.
Limitations: The text box content will not update automatically if underlying chart data changes, so you may need to edit or move notes manually if the chart layout or data is modified.
Excel Formula - Link the text box (note) to a cell so the note updates automatically when the cell content changes
Sometimes, you want the note displayed in your chart to reflect data or comments that are stored in specific worksheet cells, and have the text update automatically whenever those cells change. This approach is especially useful for dynamic reports, dashboards, or presentations where annotation content is tied to key metrics, trends, or commentary that may change through collaboration or ongoing analysis.
1. First, select the chart and use the Text Box tool to draw a text box in your chart area (see previous steps for guidance if needed).
2. With the text box still selected, click in the formula bar above the worksheet, then type an equals sign (=) followed by the reference of the cell you want to link to, for example:
=Sheet1!B2This will link the text box content directly to cell B2 on Sheet1. The text box will now show whatever is entered in that cell.
3. Press Enter to confirm. Now, whenever you update the cell, the text box in the chart will immediately reflect the change.
Advantages: This method is ideal for dashboards and live reports where annotation must reflect current data, calculations, or user-updated notes. It enables collaboration and reduces manual adjustments.
Practical tip: You can link the text box to cells containing formulas, or calculated messages for automated annotation.
Precaution: If you delete the source cell, the link will break and the formula will display a reference error. Double-check cell references after copying or moving worksheets.
Limitations: The entire chart will need to be on the same sheet as the cell being referenced, or you must use qualified references as shown.
VBA Code - Automatically add or update notes in charts through macros for dynamic or batch processing
For more advanced requirements—such as batch-processing notes for multiple charts, automating annotation updates, or conditionally adding text based on data—you can use a simple VBA macro. This solution is particularly useful for reports covering multiple chart objects, ensuring consistent note addition/updates, or for users comfortable automating routine Excel operations.
1. Select the chart in which you want to add note.
Go to Developer > Visual Basic, or press Alt + F11. In the dialog that opens, click Insert > Module, then copy and paste the following code into the module window:
Sub AddOrUpdateChartNote()
'Updated by extendoffice
    Dim chtObj As ChartObject
    Dim cht As Chart
    Dim ws As Worksheet
    Dim linkedCell As Range
    Dim noteShape As Shape
    Dim noteText As String
    Dim foundNote As Boolean
    Dim xTitleId As String

    On Error GoTo ErrHandler
    xTitleId = "Kutools for Excel"

    Set ws = ActiveSheet

    If ActiveChart Is Nothing Then
        MsgBox "Please select a chart first.", vbExclamation, xTitleId
        Exit Sub
    Else
        Set cht = ActiveChart
    End If

    Set linkedCell = Application.InputBox("Select the cell for note content:", xTitleId, Type:=8)
    If linkedCell Is Nothing Then Exit Sub

    noteText = linkedCell.Value

    foundNote = False
    For Each noteShape In cht.Shapes
        If LCase(Left(noteShape.Name, 9)) = "chartnote" Then
            noteShape.TextFrame.Characters.Text = noteText
            foundNote = True
            Exit For
        End If
    Next noteShape

    If Not foundNote Then
        Set noteShape = cht.Shapes.AddTextbox(msoTextOrientationHorizontal, 20, 20, 250, 30)
        noteShape.Name = "ChartNote_" & Format(Now, "hhnnss")
        noteShape.TextFrame.Characters.Text = noteText
        noteShape.TextFrame.AutoSize = True
        noteShape.Fill.ForeColor.RGB = RGB(255, 255, 200) ' light yellow background
        noteShape.Line.ForeColor.RGB = RGB(100, 100, 100)
    End If

    MsgBox "Chart note updated successfully!", vbInformation, xTitleId
    Exit Sub

ErrHandler:
    MsgBox "An error occurred. Please ensure a chart is selected and try again.", vbExclamation, xTitleId
End Sub
2 Then click the ![]() button to execute the macro. This will prompt you to select the the cell containing your note text. After selecting, click OK.
button to execute the macro. This will prompt you to select the the cell containing your note text. After selecting, click OK.
The macro automatically adds a yellow textbox on the chart showing the selected cell’s text.
If a note already exists, the macro updates the existing note with the new cell value (it doesn't create duplicates).
Advantages: Automate complex tasks, ensure annotation consistency, and reduce repetitive manual work. Can easily adjust macro to meet your specific note-update logic or formatting requirements.
Troubleshooting: If you don’t select a chart, the macro will show a message:“Please select a chart first.”
Precaution: Save your work before running macros and be cautious editing VBA code if unfamiliar with programming.
Related articles:
Best Office Productivity Tools
Supercharge Your Excel Skills with Kutools for Excel, and Experience Efficiency Like Never Before. Kutools for Excel Offers Over 300 Advanced Features to Boost Productivity and Save Time. Click Here to Get The Feature You Need The Most...
Office Tab Brings Tabbed interface to Office, and Make Your Work Much Easier
- Enable tabbed editing and reading in Word, Excel, PowerPoint, Publisher, Access, Visio and Project.
- Open and create multiple documents in new tabs of the same window, rather than in new windows.
- Increases your productivity by 50%, and reduces hundreds of mouse clicks for you every day!
All Kutools add-ins. One installer
Kutools for Office suite bundles add-ins for Excel, Word, Outlook & PowerPoint plus Office Tab Pro, which is ideal for teams working across Office apps.
- All-in-one suite — Excel, Word, Outlook & PowerPoint add-ins + Office Tab Pro
- One installer, one license — set up in minutes (MSI-ready)
- Works better together — streamlined productivity across Office apps
- 30-day full-featured trial — no registration, no credit card
- Best value — save vs buying individual add-in