How to create a circle within circle chart in Excel?
Have you ever tried to create a circle within circle chart as below screenshot shown? This article will share the detailed steps to create a circle within circle chart in Excel.
Create a circle within circle chart in Excel

Create a circle within circle chart in Excel
Please follow below steps to create a circle within circle chart in Excel.
1. Change the source data. Please insert two new columns in the source data, name the first column as X and type 2 in each cell of this column, next name the second column as Y and type 5 in each cell of this column. See screenshot: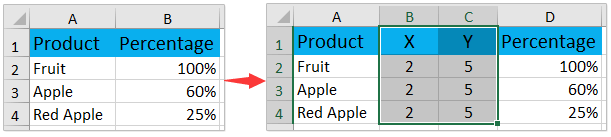
2. Please click Insert > Insert Scatter (X, Y) or Bubble Chart (or Other Charts)> Bubble directly without selecting the source data. See screenshot:
3. Now a blank chart is created. Right click the blank chart, and click Select Data from the right-clicking menu. See screenshot:
4. In the Select Data Source dialog box, please click the Add button. See screenshot:
5. In the Edit Series dialog box, please (1) specify the first product as series name; (2) specify the first value in the X column as Series X value; (3) specify the first value in the Y column as Series Y values; (4) specify the first percentage as Series bubble size; and finally (5) click the OK button. See screenshot:
6. Repeat above Step 4-5 to add other products as individual legends, and then click the OK button in the Select Data Source dialog box.
Now the circle within circle chart is created. You can change the position of the circle within circle, delete gridlines, and add other chart elements to make the chart look nice.
7. Right click the Y axis, and click Format Axis in the right clicking menu.
8. In the Format Axis pane, please type 10 (=2x5) in the Maximum box.
Note: If you using Excel 2010 or 2007, it will open the Format Axis dialog box. Please enable Axis Options in the left bar, specify the maximum axis value as fixed and equal to 10, and then close the dialog. See screenshot:
9. Please repeat above Step 7-8 to change the maximum value of X axis to 4 (=2x2).
10. Click the gridlines in the chart area, and press Delete key to delete them.
11. Under Chart Tools, Click Design > Add Chart Element > Legend > Right/Top/Bottom to add legend names.
Note: If you are using Excel 2010 or 2007, please click Layout > Legend > Show Legend a right/Top/Bottom under Chart Tools.
Now you have finished the circle within circle chart as below screenshot shown.
Related articles:
Best Office Productivity Tools
Supercharge Your Excel Skills with Kutools for Excel, and Experience Efficiency Like Never Before. Kutools for Excel Offers Over 300 Advanced Features to Boost Productivity and Save Time. Click Here to Get The Feature You Need The Most...
Office Tab Brings Tabbed interface to Office, and Make Your Work Much Easier
- Enable tabbed editing and reading in Word, Excel, PowerPoint, Publisher, Access, Visio and Project.
- Open and create multiple documents in new tabs of the same window, rather than in new windows.
- Increases your productivity by 50%, and reduces hundreds of mouse clicks for you every day!
All Kutools add-ins. One installer
Kutools for Office suite bundles add-ins for Excel, Word, Outlook & PowerPoint plus Office Tab Pro, which is ideal for teams working across Office apps.
- All-in-one suite — Excel, Word, Outlook & PowerPoint add-ins + Office Tab Pro
- One installer, one license — set up in minutes (MSI-ready)
- Works better together — streamlined productivity across Office apps
- 30-day full-featured trial — no registration, no credit card
- Best value — save vs buying individual add-in