
How to calculate area under a plotted curve in Excel?

When learning the integral, you might have drawn a plotted curve, shade an area under the curve, and then calculate the area of shading section. Here, this article will introduce two solutions to calculate area under a plotted curve in Excel.


Calculate area under a plotted curve with Trapezoidal rule

For example, you have created a plotted curve as below screenshot shown. This method will split the area between the curve and x axis to multiple trapezoids, calculate the area of every trapezoid individually, and then sum up these areas.

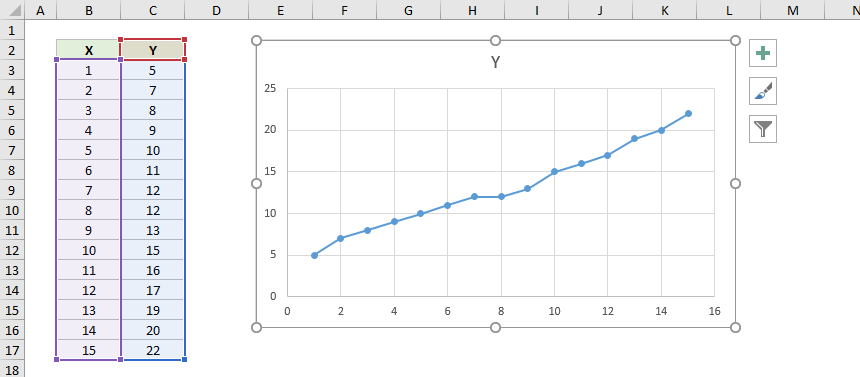
1. The first trapezoid is between x=1 and x=2 under the curve as below screenshot shown. You can calculate its area easily with this formula:  =(C3+C4)/2*(B4-B3).

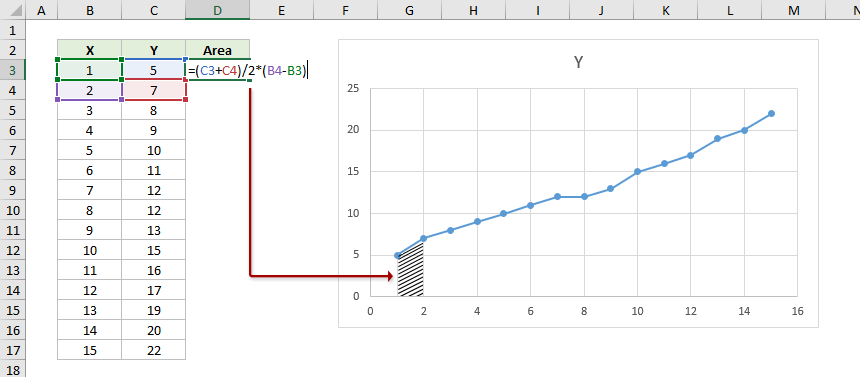
2. Then you can drag the AutoFill handle of the formula cell down to calculate areas of other trapezoids.
Note: The last trapezoid is between x=14 and x=15 under the curve. Therefore, drag the AutoFill handle to the second to last cell as below screenshot shown.   

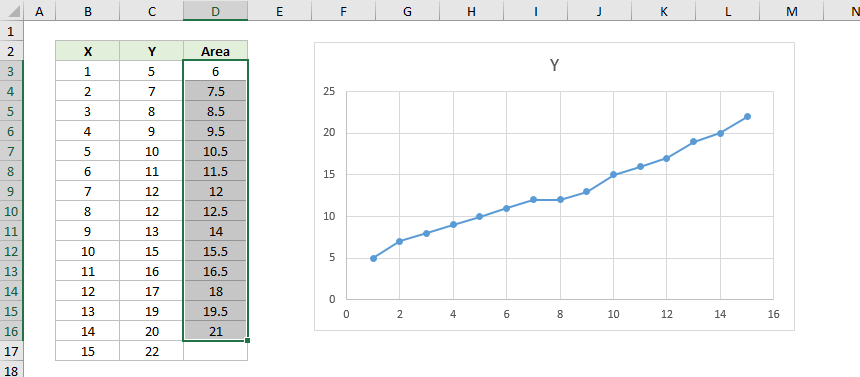
3. Now the areas of all trapezoids are figured out. Select a blank cell, type the formula =SUM(D3:D16) to get the total area under the plotted area.

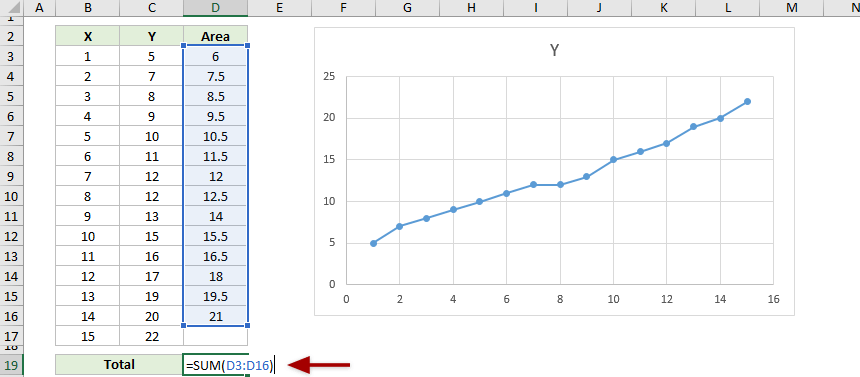
Calculate area under a plotted curve with chart trendline

This method will use the chart trendline to get an equation for the plotted curve, and then calculate area under the plotted curve with the definite integral of the equation.

1. Select the plotted chart, and click Design (or Chart Design) > Add Chart Element > Trendline > More Trendline Options. See screenshot:

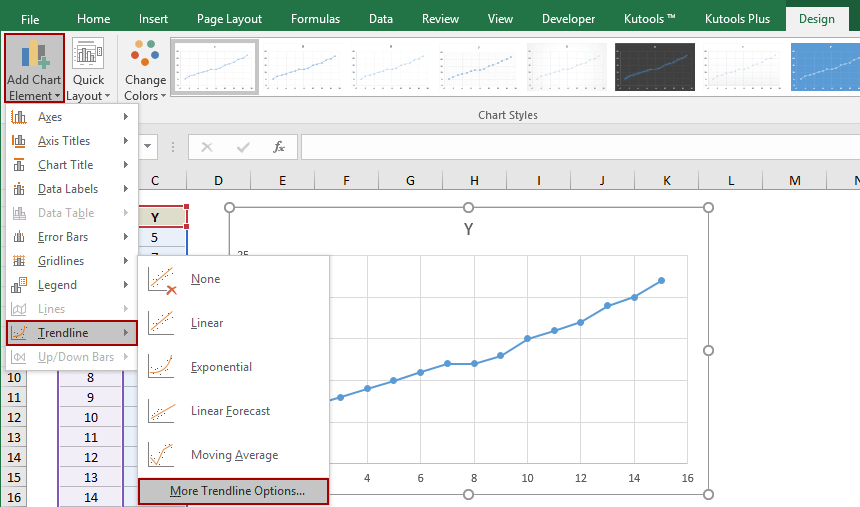
2. In the Format Trendline pane:
(1) In the Trendline Options section, choose one option which is most matched with your curve;
(2) Check the Display Equation on chart option.

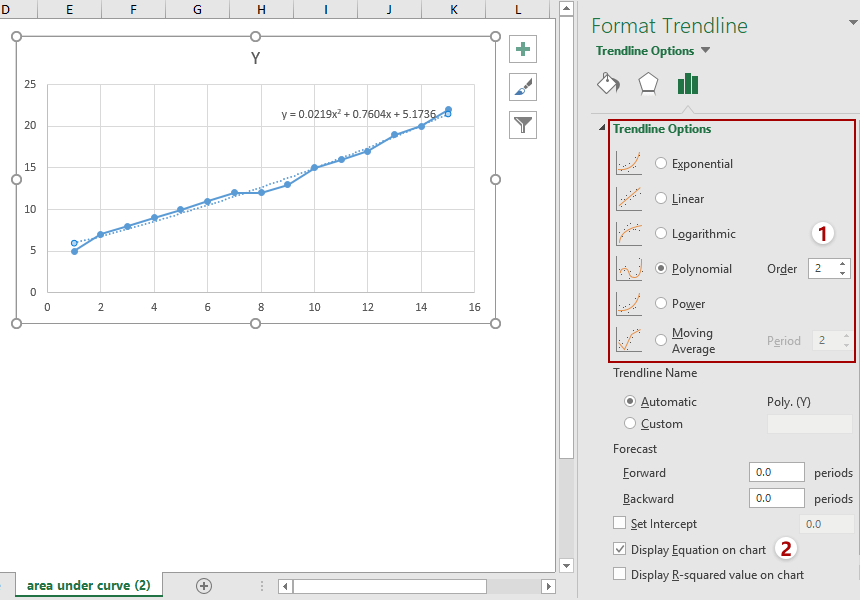
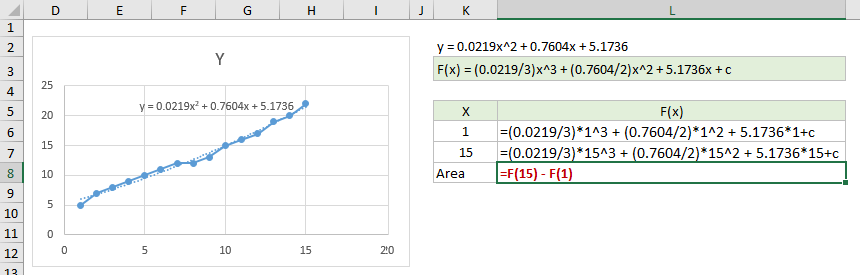
3. Now the equation is added into the chart. Copy the equation into your worksheet, and then get the definite integral of the equation.

In my case, the equation general by trendline is y = 0.0219x^2 + 0.7604x + 5.1736, therefore its definite integral is F(x) = (0.0219/3)x^3 + (0.7604/2)x^2 + 5.1736x + c.

4. Now we plug in the x=1 and x=15 to the definite integral, and calculate the difference between both calculations results. The difference represents the area under the plotted curve.
 

Area = F(15)-F(1)
Area =(0.0219/3)*15^3+(0.7604/2)*15^2+5.1736*15-(0.0219/3)*1^3-(0.7604/2)*1^2-5.1736*1
Area = 182.225


Related articles:

Best Office Productivity Tools

🤖 Kutools AI Aide: Revolutionize data analysis based on: Intelligent Execution   |  Generate Code  |  Create Custom Formulas  |  Analyze Data and Generate Charts  |  Invoke Kutools Functions
Popular Features: Find, Highlight or Identify Duplicates   |  Delete Blank Rows   |  Combine Columns or Cells without Losing Data   |   Round without Formula ...
Super Lookup: Multiple Criteria VLookup    Multiple Value VLookup  |   VLookup Across Multiple Sheets   |   Fuzzy Lookup ....
Advanced Drop-down List: Quickly Create Drop Down List   |  Dependent Drop Down List   |  Multi-select Drop Down List ....
Column Manager: Add a Specific Number of Columns  |  Move Columns  |  Toggle Visibility Status of Hidden Columns  |  Compare Ranges & Columns ...
Featured Features: Grid Focus   |  Design View   |   Big Formula Bar    Workbook & Sheet Manager   |  Resource Library (Auto Text)   |  Date Picker   |  Combine Worksheets   |  Encrypt/Decrypt Cells    Send Emails by List   |  Super Filter   |   Special Filter (filter bold/italic/strikethrough...) ...
Top 15 Toolsets12 Text Tools (Add Text, Remove Characters, ...)   |   50+ Chart Types (Gantt Chart, ...)   |   40+ Practical Formulas (Calculate age based on birthday, ...)   |   19 Insertion Tools (Insert QR Code, Insert Picture from Path, ...)   |   12 Conversion Tools (Numbers to Words, Currency Conversion, ...)   |   7 Merge & Split Tools (Advanced Combine Rows, Split Cells, ...)   |   ... and more

Supercharge Your Excel Skills with Kutools for Excel, and Experience Efficiency Like Never Before. Kutools for Excel Offers Over 300 Advanced Features to Boost Productivity and Save Time.  Click Here to Get The Feature You Need The Most...

Description


Office Tab Brings Tabbed interface to Office, and Make Your Work Much Easier

  • Enable tabbed editing and reading in Word, Excel, PowerPoint, Publisher, Access, Visio and Project.
  • Open and create multiple documents in new tabs of the same window, rather than in new windows.
  • Increases your productivity by 50%, and reduces hundreds of mouse clicks for you every day!
Comments (9)
No ratings yet. Be the first to rate!
This comment was minimized by the moderator on the site
Danke für das Tutorial,

ich habe ein Verständnisproblem zum bestimmten Integral.
1. warum ist in der Formel das "c" und warum verschwindet es beim Einsetzen wieder?
2. wenn ich 1 und 15 in meine Formel einfüge, sind dies doch lediglich die Werte der X Achse. Also meine Messpunkte aber nicht meine Messwerte. Die "echten" Werte meines Diagrams sind die auf der Y-Achse und diese werden doch dann nicht berücksichtigt, oder?
This comment was minimized by the moderator on the site
Bonjour,
Pourriez-vous m'expliquer à quoi corresponds le petit "c" en fin d'équation de F(x) ?
Merci beaucoup !
This comment was minimized by the moderator on the site
Wie kommen Sie von der Trendlinie zum bestimmten Integral?

Sie beschreiben, dass ich die Gleichung der Trendlinie in das Arbeitsblatt kopieren soll. Wie soll das funktionieren?

Kopieren Sie die Gleichung in Ihr Arbeitsblatt und erhalten Sie dann das bestimmte Integral der Gleichung.
In meinem Fall lautet die allgemeine Gleichung nach Trendlinie y = 0.0219x ^ 2 + 0.7604x + 5.1736daher ist sein bestimmtes Integral F (x) = (0.0219 / 3) x ^ 3 + (0.7604 / 2) x ^ 2 + 5.1736x + c.
This comment was minimized by the moderator on the site
Ik heb een dataplot waarbij de waardes van de X-as variëren tussen negatieve en positieve waardes.
Bv -80 tot +80. Als ik daarbij deze regels volg, maak ik denk ik een fout tussen de 2 data punten op de overgang van positief naar negatief, aangezien ik som een negatieve oppervlak onder de curve uitkom, zowel met trapezium als met integraal methode.
Ik ken het kruispunt (x=0) niet altijd, dus kan de grafiek niet in 2 stukken opsplitsen.
Kunnen jullie me helpen hoe ik dit best aanpak?

Thx!
Sofie
This comment was minimized by the moderator on the site
Thank you for explaining.. I learned the same, that I did not know before. really helps me a lot.RegardsDebashis
This comment was minimized by the moderator on the site
The formula for the trapezoid rule should be =((C3+C4)/2)*(B4-B3) instead of =(C3+C4)/2*(B4-B3). Otherwise you will divide C3+C4 by 2*(B4-B3), instead of multiplying (C3+C4)/2 by (B4-B3)
This comment was minimized by the moderator on the site
Hi Bas,
Actually the formula will be calculated just like what it's like when you do mathematical operation. It makes no difference if you add the additional brackets to (C3+C4)/2 or not. Unless you add the brackets this way: (C3+C4)/(2*(B4-B3)), then it will divide C3+C4 by 2*(B4-B3).
Anyway, thanks for your feedback. If you have any other questions, please don't hesitate to let me know. :)
Amanda
This comment was minimized by the moderator on the site
You are correct, my apologies. I was under the assumption that multiplication had precedence over division, as I learned in school many years ago, but apparently that rule changed almost 30 years ago and I only now became aware of that. Well, better late than never, so thank you for correcting me.
This comment was minimized by the moderator on the site
You are welcome Bas, and I do feel happy for you gaining one more little knowledge here :)
There are no comments posted here yet
Please leave your comments in English
Posting as Guest
×
Rate this post:
0   Characters
Suggested Locations