How to highlight rows based on cell value in Excel?
In Excel, we always deal with large data sets. To find out the data you need at a glance, you can highlight the entire rows in which specific cells meet certain criteria, say, the cells contain a value that’s greater than or less than a specific value. To solve this problem, we’ve gathered two methods in this tutorial, please read on to find out how.

Highlight rows based on cell value with Conditional Formatting
With Excel’s built-in Conditional Formatting feature, you can highlight the rows that contain a cell value greater or less than a specified value quickly. Let’s say you want to highlight the rows of the items whose sales value exceeds $1,500, please follow the steps below.
1. Select the data range (A2:D12) where you will highlight the entire rows based on the sales value. Note that do not include the headers.
2. On the "Home" tab, in the "Styles" group, click "Conditional Formatting" > "New Rule".
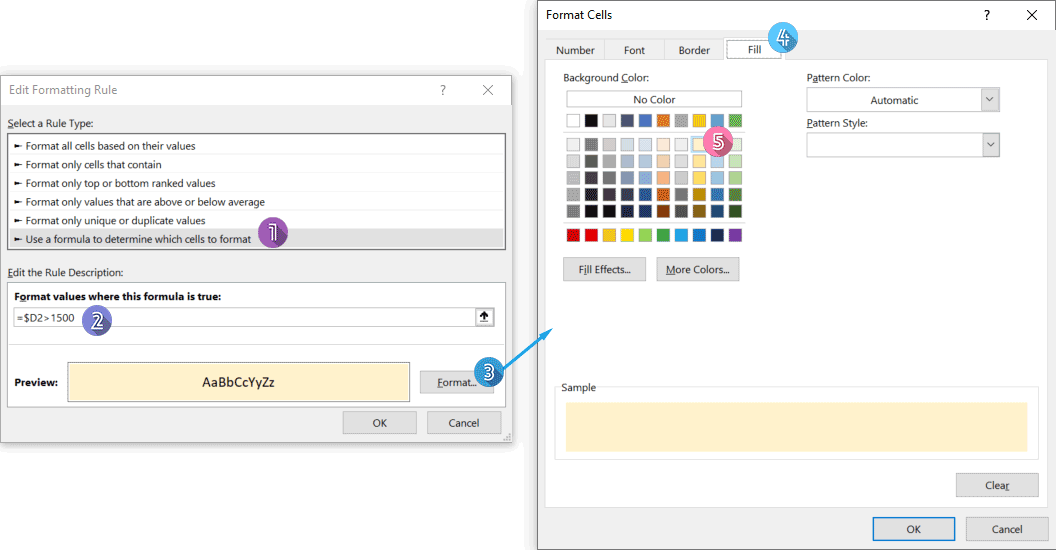
- In the "Select a Rule Type" box, select "Use a formula to determine which cells to format".
- In the "Format values where this formula is true" box, enter the following formula:
=$D2>1500Note: The dollar sign ($) before the column letter D makes the rule check each sale value starting from the 2nd row along the column "D" (sales column). - Click on "Format" to open the "Format Cells" dialog, and then set the color in which you want the row to get highlighted on the "Fill" tab.

4. Click on the "OK" buttons to close the two dialog boxes. The rows that meet the condition are highlighted at once.
Highlight rows based on cell value with Select Specific Cells feature (based on two conditions)
Kutools for Excel offers the Select Specific Cells feature to help you find multiple values that meet one or two conditions you set at once, so that you can highlight the corresponding rows easily. Please read on to find out how to quickly highlight the rows of the items whose sales value is between $1,500 and $3,000.
1. On the "Kutools" tab, in the "Editing" group, click "Select" > "Select Specific Cells".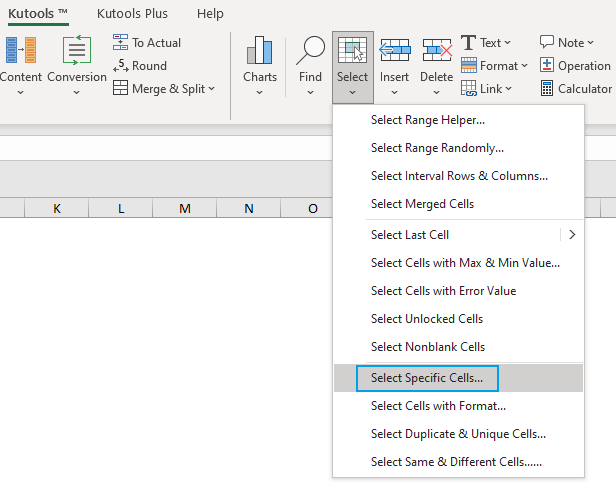
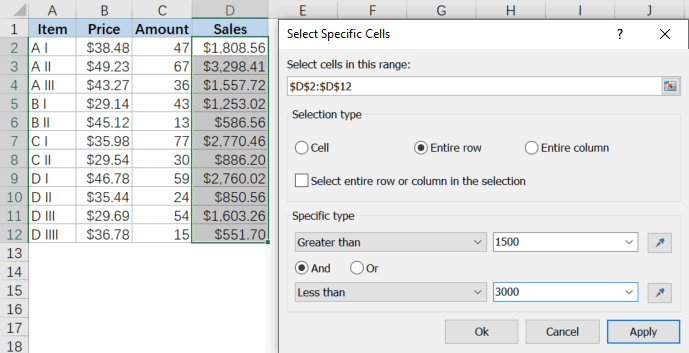
- In the "Select cells in this range" box, click the range-selecting button at right to specify the sales column based on which to highlight the entire rows.
- In the "Selection type" section, select the "Entire row" option.
- In the "Specific type" section, set the two conditions:
- Click on the drop-down arrow at left side to select the "Greater than" relationship, then type "1500" in the corresponding box.
- Click on the drop-down arrow at left side to select the "Less than" relationship, then type "3000" in the corresponding box.
- Specify "And" as the relationship between the two conditions.
3. Click "Ok". The corresponding rows that meet the criteria are selected at once. Now go to the "Home" tab and select a fill color you want to highlight the rows.
Kutools for Excel - Supercharge Excel with over 300 essential tools, making your work faster and easier, and take advantage of AI features for smarter data processing and productivity. Get It Now
Demo: Highlight rows based on cell value in Excel
Related articles
How To Highlight Rows When Cell Value Changes In Excel?
If there is a list of repeated values in your worksheet, and you need to highlight the rows based on column A which cell value changes as following screenshot shown. In fact, you can quickly and easily finish this job by using the Conditional Formatting feature.
How To Highlight Rows With Weekend Days In Excel
Today, I will talk about how to highlight weekend’s rows in Excel by using this Conditional Formatting and a handy tool.
How To Highlight Row If Cell Contains Text/Value/Blank In Excel?
For example we have a purchase table in Excel, now we want to find out the purchase orders of apple and then highlight the entire rows where the orders of apple are in as the left screen shot shown. We can get it done easily with Conditional Formatting command or Kutools for Excel's features in Excel.
How To Select And Highlight Row Differences In Excel?
Supposing there is a range of cells, and what you want is to select and highlight the row differences as below screenshot shown. Obviously, you can check and select them one by one, but it is time-wasting. In this article, I introduce some quick tricks for you to select and highlight the row differences in Excel.
Best Office Productivity Tools
Supercharge Your Excel Skills with Kutools for Excel, and Experience Efficiency Like Never Before. Kutools for Excel Offers Over 300 Advanced Features to Boost Productivity and Save Time. Click Here to Get The Feature You Need The Most...
Office Tab Brings Tabbed interface to Office, and Make Your Work Much Easier
- Enable tabbed editing and reading in Word, Excel, PowerPoint, Publisher, Access, Visio and Project.
- Open and create multiple documents in new tabs of the same window, rather than in new windows.
- Increases your productivity by 50%, and reduces hundreds of mouse clicks for you every day!
All Kutools add-ins. One installer
Kutools for Office suite bundles add-ins for Excel, Word, Outlook & PowerPoint plus Office Tab Pro, which is ideal for teams working across Office apps.
- All-in-one suite — Excel, Word, Outlook & PowerPoint add-ins + Office Tab Pro
- One installer, one license — set up in minutes (MSI-ready)
- Works better together — streamlined productivity across Office apps
- 30-day full-featured trial — no registration, no credit card
- Best value — save vs buying individual add-in