Excel Variance Calculation: A Guide with Examples
Variance is a statistical measure that tells us how much a set of numbers is spread out. It's a crucial concept in finance, science, and many other fields, helping us understand the variability or dispersion within our data sets. Excel provides a straightforward way to calculate variance, making it accessible for both beginners and advanced users. In this article, we’ll explore how to do this with clear examples.
What is variance?
Introduction to Excel variance functions
How to calculate variance in Excel?
- VAR.S vs VAR.P – Calculate variance from sample or population
- VAR.S vs VARA – Calculate variance including or excluding texts and logical texts
Variance vs Standard deviation
What is variance?
Variance is a statistical term that describes the extent to which numbers in a data set differ from the mean, or average, of the numbers. Essentially, it measures how spread out the numbers are. A key point in understanding variance is recognizing that it quantifies the degree of variation or dispersion within a set of values. A high variance indicates that the numbers are spread out; a low variance suggests they are clustered closely around the mean.
A Simple Example to Illustrate Variance:
Scenario: Consider a class with five students and their scores in a math test out of 100. The scores are 90, 92, 88, 91, and 89.
Calculate the Mean: First, we find the average (mean) score. The mean is
Calculate Variance: Then, we calculate the variance. This involves subtracting the mean from each score, squaring the result, and then averaging these squared differences.
= [0 + 4 + 4 + 1 + 1] / 5
= 10 / 5
= 2
A chart displayed the spread of score:

Understanding the Result:
Low Variance: In this example, the variance is 2. This is relatively low, indicating that most scores are close to the mean (90). The lower the variance, the closer the individual numbers in the set are to the mean.
Zero Variance: If all students had scored exactly 90, the variance would be 0, indicating no variability at all. Every score would be the same.
High Variance: Conversely, a higher variance would indicate that the scores are more spread out from the mean, showing greater variability in students' performance.
In summary, variance gives us a numerical value that helps quantify how much the scores (or any set of numbers) deviate from the average value, providing insights into the consistency or variability of the data.
Introduction to Excel variance functions
Excel provides several functions to calculate variance, each designed for different data scenarios.
Understanding these functions is crucial for accurate statistical analysis
VAR.S (Sample Variance, only including numbers):
- Calculates the variance based on a sample of a population.
- Best used when analyzing a subset of data to infer about the whole.
VAR.P (Population Variance, only including numbers):
- Calculates the variance for the entire population.
- Ideal for when you have complete data and not just a sample.
VARA (Sample Variance, including text and logicals):
- Similar to VAR.S but includes text and logical values in the calculation (text is treated as 0, TRUE as 1, FALSE as 0).
- Useful when your data set contains mixed types (numbers, text, and logical values).
VARPA (Population Variance, including text and logicals):
- The population variance version of VARA.
- Includes all types of data in the variance calculation for the entire population.
VAR (Legacy Sample Variance):
- An older version of VAR.S, primarily used in Excel 2007 and earlier.
- It is recommended to use VAR.S in newer versions for consistency and clarity.
VARP (Legacy Population Variance):
- The older version of VAR.P.
- Like VAR, it's recommended to use VAR.P in newer Excel versions.
Differences and Comparisons:
- Sample vs. Population: VAR.S and VARA are for samples, while VAR.P and VARPA are for the entire population.
- Data Type Consideration: VARA and VARPA include text and logical values in the calculation, unlike VAR.S and VAR.P.
- Legacy vs. Modern Functions: VAR and VARP are older functions and can be replaced by VAR.S and VAR.P for better compatibility with current Excel versions.
Comparison Table:
| Function | Data Type Considered | Population or Sample | Use Case |
| VAR.S | Only Numbers | Sample | Sample variance for numerical data |
| VAR.P | Only Numbers | Population | Population variance for numbers |
| VARA | Numbers, Text, Logicals | Sample | Sample variance for mixed data |
| VARPA | Numbers, Text, Logicals | Population | Population variance for mixed data |
| VAR | Only Numbers | Sample | Legacy function for sample variance |
| VARP | Only Numbers | Population | Legacy function for popular |

Unlock Excel Magic with Kutools AI
- Smart Execution: Perform cell operations, analyze data, and create charts—all driven by simple commands.
- Custom Formulas: Generate tailored formulas to streamline your workflows.
- VBA Coding: Write and implement VBA code effortlessly.
- Formula Interpretation: Understand complex formulas with ease.
- Text Translation: Break language barriers within your spreadsheets.
How to calculate variance in Excel?
In this section, we will provide two examples to demonstrate how to calculate variance in Excel and explain the differences between various variance functions. As a result, you will see that different variance functions yield entirely different results for the same example data.
VAR.S vs VAR.P – Calculate variance from sample or population
Scenario: Calculating variance for a small sample of a population vs the entire population.
Example: Calculate the variance for the values in column A2:A12.
Formula: Select a blank cell and type one of below formulas as you need, then press Enter key.
Getting the variances for the sample of a large dataset (supposing the values in A2:A12 are parts of a large dataset)
=VAR.S(A2:A12)
Getting the variance for entire population (supposing the values in A2:A12 are the whole dataset)
=VAR.P(A2:A12)


As you see, the same values but use different variance functions will get different results.
Why the results of VAR.S and VAR.P are different?
- VAR.S: This function is used when your dataset represents a sample from a larger population. It calculates the variance based on the "n-1" method, where "n" is the number of data points in the sample. Using "n-1" instead of "n" as the denominator corrects for bias in the sample, making it an unbiased estimator of the population variance. It provides an estimate of how the data in the sample varies around the sample mean.
- VAR.P: This function is used when your dataset represents an entire population, not just a sample from it. It calculates the variance based on the "n" method, where "n" is the number of data points in the population. It assumes that the dataset covers the entire population, so there is no need to correct for bias as in VAR.S.
- In summary, the key difference is in the denominator of the formula. VAR.S uses "n-1" to account for the sample nature of the data, while VAR.P uses "n" for population data where there's no sampling involved. Depending on your dataset and whether it's a sample or a full population, you should choose the appropriate function to calculate variance.
VAR.S vs VARA – Calculate variance including or excluding texts and logical texts
Scenario: Deciding whether to include logical values and texts in the variance calculation.
Example: Calculate the variance for the values in column A2:A12.
Formula: Select a blank cell and type one of below formulas as you need, then press Enter key.
Getting the variances for the sample of a large dataset ignoring texts and logical values.
=VAR.S(A2:A12)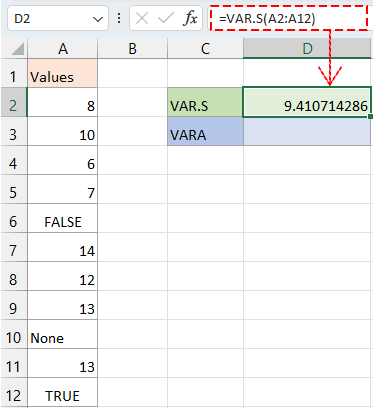
Getting the variance for the sample of a large dataset including texts and logical values.
=VARA(A2:A12)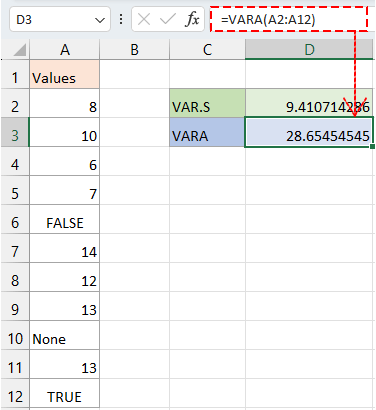


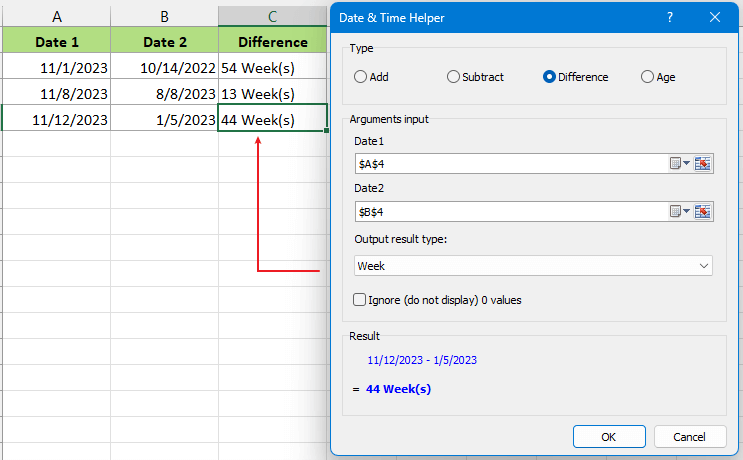
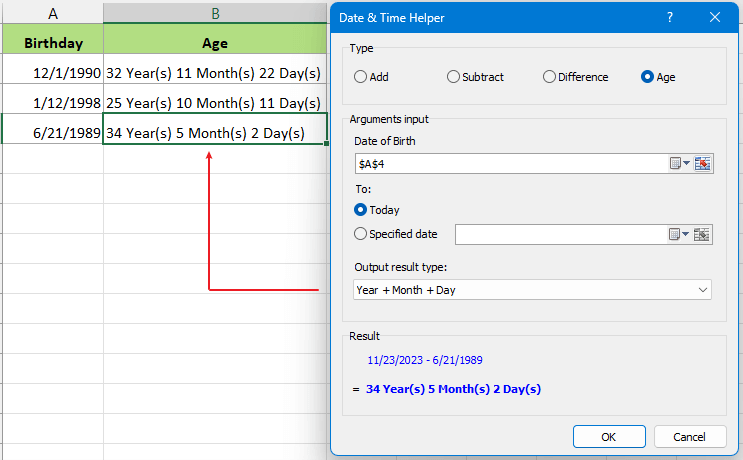
Make Datetime Calculation Fly
Kutools for Excel's Date Time Helper is an incredibly efficient tool designed to simplify complex date and time calculations. Give it a try and see how it transforms your data management experience!

Variance vs Standard deviation
Similarities:
Measure of Spread:
Both variance and standard deviation are statistical measures used to describe the spread or dispersion within a data set. They quantify how far individual numbers in the set deviate from the mean (average).
Data Analysis:
Both are commonly used in statistical analysis for understanding data variability. They are essential in fields like finance, research, quality control, and more.
Calculated from the Mean:
The calculation of both variance and standard deviation starts with the mean of the data set. They assess variability in relation to this central value.
Differences:
Units of Measure:
Variance: Squared units of the original data. For instance, if data is in meters, variance will be in square meters.
Standard Deviation: Same units as the original data. Continuing the example, if data is in meters, standard deviation will also be in meters.
Interpretation:
Variance: Provides a squared estimate which can be less intuitive to interpret because it's not in the same scale as the original data.
Standard Deviation: More interpretable as it’s in the same units as the data. It indicates the average distance of data points from the mean.
Mathematical Definition:
Variance: The average of the squared differences from the Mean.
Standard Deviation: The square root of the variance.
Sensitivity to Extreme Values:
Variannce: More sensitive to outliers because it squares the differences.
Standard Deviation: Although affected by outliers, it is less sensitive compared to variance due to the square root.
Applications:
Variance:
Used when the focus is on the squared magnitude of dispersion.
Beneficial in statistical models and computations where squaring is necessary to nullify negative values.
Often used in financial models for risk assessment, as it measures volatility.
Standard Deviation:
More commonly used in reports and daily applications due to its direct relation to the data scale.
Essential in empirical research to understand the variability.
Frequently used in quality control, weather reports, and standard scores in tests.
Conclusion:
While variance and standard deviation both serve to measure the spread of a data set, their applications differ due to their unit of measurement and interpretability. Standard deviation, with its direct relation to the data's scale, tends to be more user-friendly, particularly in practical, everyday contexts. Variance, on the other hand, is often more suited to mathematical and statistical models.
This overview and comparison should provide a clear understanding of when and why to use each variance function in Excel, allowing for more accurate and meaningful data analysis. For more game-changing Excel strategies that can elevate your data management, explore further here..
The Best Office Productivity Tools
Kutools for Excel - Helps You To Stand Out From Crowd
Kutools for Excel Boasts Over 300 Features, Ensuring That What You Need is Just A Click Away...
Office Tab - Enable Tabbed Reading and Editing in Microsoft Office (include Excel)
- One second to switch between dozens of open documents!
- Reduce hundreds of mouse clicks for you every day, say goodbye to mouse hand.
- Increases your productivity by 50% when viewing and editing multiple documents.
- Brings Efficient Tabs to Office (include Excel), Just Like Chrome, Edge and Firefox.
Table of contents
- What is variance?
- Introduction to Excel variance functions
- How to calculate variance in Excel?
- VAR.S vs VAR.P – Calculate variance from sample or population
- VAR.S vs VARA – Calculate variance including or excluding texts and logical texts
- Variance vs Standard deviation
- Related Articles
- Best Office Productivity Tools
- Comments