How to Group Dates by Early, Middle, and Late of Month in an Excel PivotTable
When analyzing monthly data in Excel, grouping by month is often not enough. In many cases, you may want to see whether sales, orders, attendance, or other activity happened more often in the early, middle, or late part of each month. However, Excel PivotTable does not provide a built-in option to group dates directly into Early, Middle, and Late of Month. In this guide, you will learn two practical methods: using Excel PivotTable’s built-in grouping as a workaround, and using Kutools for Excel to create clearer and more intuitive groups.

- Why group dates by early, middle, and late of month in a PivotTable
- Method 1: Approximate the grouping with Excel PivotTable built-in feature
- Method 2: Quickly group dates by early, middle, and late of month with Kutools for Excel
- Excel vs. Kutools: which method should you use
- Frequently asked questions
Why group dates by early, middle, and late of the month in a PivotTable
Grouping dates by month gives a broad overview, but it does not show what happens within the month. If you need to compare activity across different parts of each month, grouping dates into Early, Middle, and Late can make your PivotTable much more useful.
For example, this type of grouping can help you:
- see whether sales increase near the end of the month;
- identify when most orders are placed;
- spot attendance or workload patterns across the month;
- create reports that are easier to read than raw daily date groupings.
Although Excel PivotTable can group dates by standard time units such as days, months, quarters, and years, it cannot directly create Early / Middle / Late of Month labels. That is why the following two methods can help.
Method 1: Approximate the grouping with Excel PivotTable built-in feature
If you want to do this using Excel alone, the closest built-in workaround is to group dates by 10-day intervals. This does not produce true Early, Middle, and Late labels, but it can roughly divide each month into three parts.
Step 1: Create a PivotTable from your source data
Select your source data, then go to Insert > PivotTable, choose where to place the PivotTable, and click OK.
Step 2: Add the date field and other fields to build the PivotTable
In the PivotTable Fields pane, drag your date field into the Rows area first. Then add the other fields you want to analyze to the appropriate areas, such as placing a category field in Columns and a numeric field in Values, so the PivotTable shows meaningful results.
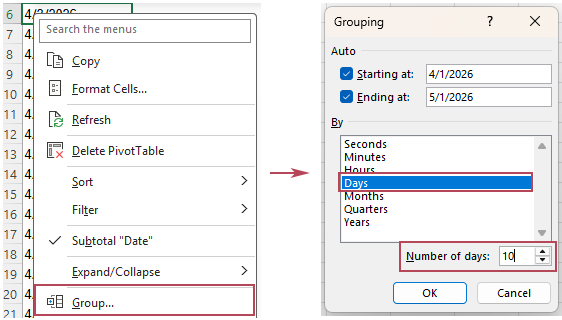
Step 3: Group the dates by 10 days
Right-click any date in the PivotTable, and choose Group. In the Grouping dialog box:
- check Days;
- enter 10 in the Number of days box;
- click OK.

Result
Excel will group the dates into date ranges such as:
- 4/1/2026 - 4/10/2026
- 4/11/2026 - 4/20/2026
- 4/21/2026 - 4/30/2026
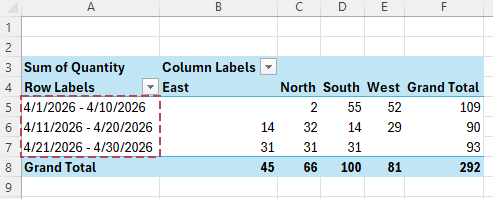

This method gives you a quick approximation of early-, middle-, and late-month analysis, but the output appears as date ranges, not as clear labels like Early, Middle, and Late.
- No extra tool is required
- Quick to set up for one-time analysis
- Works directly inside Excel PivotTable
- Cannot create true Early / Middle / Late text labels
- Shows date ranges instead of intuitive group names
- The last group may look uneven because months have different numbers of days
Method 2: Quickly group dates by early, middle, and late of month with Kutools for Excel
If you want a clearer and more intuitive result, Kutools for Excel offers a much easier solution with its PivotTable Special Time Grouping feature. It can automatically create a grouped helper field from your date column, making it simple to build a PivotTable grouped by Early, Middle, and Late of month.
Step 1: Open PivotTable Special Time Grouping
Click Kutools Plus > Pivot Table > PivotTable Special Time Grouping.
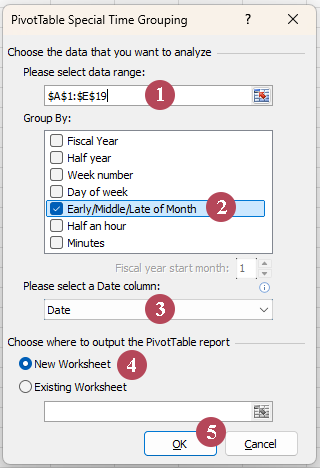
Step 2: Configure the grouping options
In the PivotTable Special Time Grouping dialog box, do the following:
- select the data range that you want to create the PivotTable from;
- choose Early / Middle / Late of Month from the Group By list box;
- select the date column you want to group by;
- choose where to place the PivotTable, either in a new worksheet or in the current worksheet;
- Click OK.

Step 3: Adjust the PivotTable layout as needed
Once the PivotTable is generated, the new Early / Middle / Late of Month field is automatically placed in the Rows area. You can then add other fields to the Values, Columns, or Filters areas to build the report you need.
Result
You get a more intuitive PivotTable grouped by Early of Month, Middle of Month, and Late of Month, which makes monthly trends easier to spot at a glance. Kutools also automatically creates a matching helper column on the right side of the source data.
- Creates clear Early / Middle / Late grouping labels automatically
- Easier to understand than raw 10-day date ranges
- More practical for recurring reports and monthly analysis
- Saves time compared with manual PivotTable workarounds
- Automatically adds the grouped helper field for you
- Makes PivotTable results cleaner and easier to read
- Easy to use with a clear and guided interface
Excel vs. Kutools: which method should you use
| Feature | Excel PivotTable built-in grouping | Kutools for Excel |
|---|---|---|
| Ease of setup | ⚪ Moderate | ✅ Easy |
| Grouping result | ❌ Only 10-day date ranges | ✅ Clear Early / Middle / Late labels |
| Readability | ⚪ Average | ✅ Clear |
| True month-part grouping | ❌ No | ✅ Yes |
| Best for | ✅ Quick temporary analysis | ✅ Cleaner recurring reports |
If you only need a quick workaround, Excel’s built-in grouping can help. But if you want a more intuitive result that is easier to use in reports, Kutools for Excel is the better choice.
Frequently asked questions
Can Excel PivotTable alone do it without a helper column?
No. Excel PivotTable cannot directly group dates into true Early / Middle / Late of Month labels without a helper column. Its built-in grouping can only group dates by standard time units or fixed intervals, such as 10 days. So if you need exact Early, Middle, and Late labels, you need either a helper column or a tool like Kutools that creates it automatically.
Why does Excel show date ranges instead of Early, Middle, and Late?
Because Excel’s native PivotTable grouping is based on date intervals, not custom text categories. That is why it can group by 10-day ranges, but it cannot automatically label those ranges as Early, Middle, or Late.
Which method is better for monthly reporting?
If you only need a quick one-time analysis, Excel’s built-in grouping may be enough. If you create reports regularly and want cleaner, easier-to-read results, Kutools is the more practical option.
Conclusion
Grouping dates by Early, Middle, and Late of Month can make PivotTable reports much easier to interpret. While Excel PivotTable can only approximate this with 10-day groupings, Kutools for Excel provides a more direct and readable solution.
If your goal is a quick workaround, use Excel’s built-in grouping. If you want cleaner labels and a better reporting experience, use Kutools.
Best Office Productivity Tools
Supercharge Your Excel Skills with Kutools for Excel, and Experience Efficiency Like Never Before. Kutools for Excel Offers Over 300 Advanced Features to Boost Productivity and Save Time. Click Here to Get The Feature You Need The Most...
Office Tab Brings Tabbed interface to Office, and Make Your Work Much Easier
- Enable tabbed editing and reading in Word, Excel, PowerPoint, Publisher, Access, Visio and Project.
- Open and create multiple documents in new tabs of the same window, rather than in new windows.
- Increases your productivity by 50%, and reduces hundreds of mouse clicks for you every day!
All Kutools add-ins. One installer
Kutools for Office suite bundles add-ins for Excel, Word, Outlook & PowerPoint plus Office Tab Pro, which is ideal for teams working across Office apps.
- All-in-one suite — Excel, Word, Outlook & PowerPoint add-ins + Office Tab Pro
- One installer, one license — set up in minutes (MSI-ready)
- Works better together — streamlined productivity across Office apps
- 30-day full-featured trial — no registration, no credit card
- Best value — save vs buying individual add-in
Table of Contents
- Why group dates by early, middle, and late of month in a PivotTable
- Method 1: Approximate the grouping with Excel PivotTable built-in feature
- Method 2: Quickly group dates by early, middle, and late of month with Kutools for Excel
- Excel vs. Kutools: which method should you use
- Frequently asked questions
- The Best Office Productivity Tools
Kutools for Excel
Brings 300+ advanced features to Excel
- 🧩 Overview
- 📥 Free Download
- 🎁 30-Day Free Trial available