How to create pie of pie or bar of pie chart in Excel?
The pie chart can reflect the number of relations between part and part, part and whole, it used to show the percentage. If there are several tiny slices even less than 10 percent of your pie chart, it is hard for you to see them. In this case, you can use the pie of pie or bar of pie chart to make your chart more coherent. However, how to create a pie of pie or bar of pie chart in Excel?
Create a pie of pie or bar of pie chart in Excel
Create a pie of pie or bar of pie chart in Excel
A pie of pie or bar of pie chart, it can separate the tiny slices from the main pie chart and display them in an additional pie or stacked bar chart as shown in the following screenshot, so you can see the smaller slices more visible or easier.
The following steps can help you to create a pie of pie or bar of pie chart:
1. Create the data that you want to use as follows:
2. Then select the data range, in this example, highlight cell A2:B9. And then click Insert > Pie > Pie of Pie or Bar of Pie, see screenshot:
3. And you will get the following chart:
4. Then you can add the data labels for the data points of the chart, please select the pie chart and right click, then choose Add Data Labels from the context menu and the data labels are appeared in the chart. See screenshots: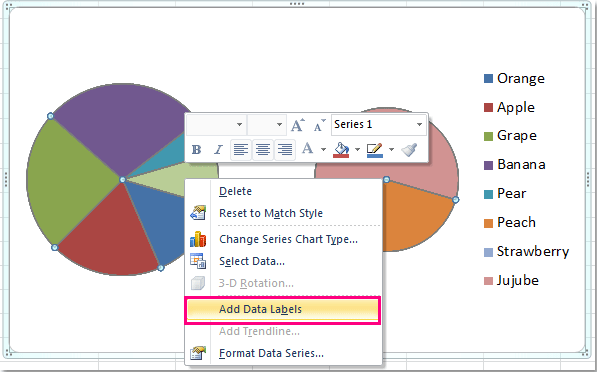
And now the labels are added for each data point. See screenshot:
5. Go on selecting the pie chart and right clicking, then choose Format Data Series from the context menu, see screenshot: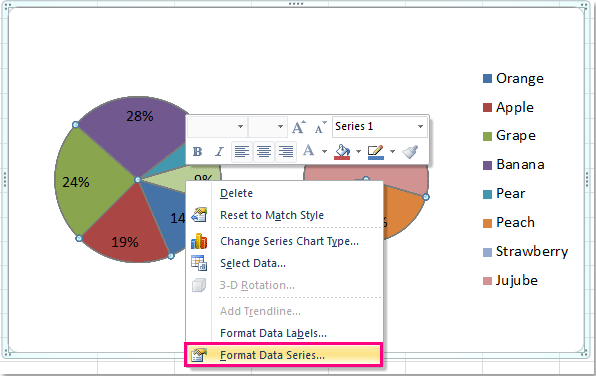
6. In the Format Data Series dialog, click the drop down list beside Split Series By to select Percentage value, and then set the value you want to display in the second pie, in this example, I will choose 10% . You can change it as you need.
7. Then close the dialog box, if you create the Pie of pie chart, you will get this:
And if you create the Bar of pie chart, after following the above steps, you will get the following chart: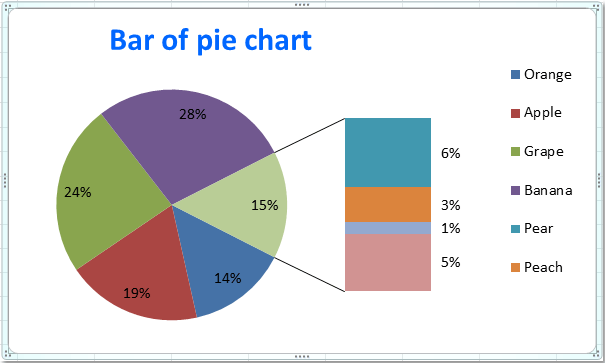
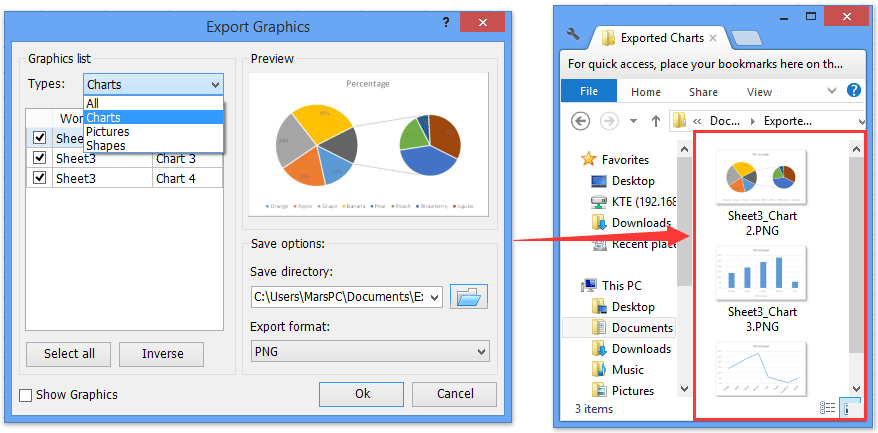
Batch save multiple charts as JPEG/PNG/TIF/GIF images in Excel
Kutools for Excel’s Export Graphics utility can help Excel users quickly export and save all graphics (including pictures, shapes, and charts) as images. And exported graphics can be saved as many formats, such as JPEG, GIF, TIF, or PNG.
Demo: Create a pie of pie or bar of pie chart in Excel
Related articles:
- How to create dynamic interactive chart in Excel?
- How to create Gantt chart in Excel?
- How to create simple Pareto chart in Excel?
- How to add a scrollbar to chart in Excel?
Best Office Productivity Tools
Supercharge Your Excel Skills with Kutools for Excel, and Experience Efficiency Like Never Before. Kutools for Excel Offers Over 300 Advanced Features to Boost Productivity and Save Time. Click Here to Get The Feature You Need The Most...
Office Tab Brings Tabbed interface to Office, and Make Your Work Much Easier
- Enable tabbed editing and reading in Word, Excel, PowerPoint, Publisher, Access, Visio and Project.
- Open and create multiple documents in new tabs of the same window, rather than in new windows.
- Increases your productivity by 50%, and reduces hundreds of mouse clicks for you every day!
All Kutools add-ins. One installer
Kutools for Office suite bundles add-ins for Excel, Word, Outlook & PowerPoint plus Office Tab Pro, which is ideal for teams working across Office apps.
- All-in-one suite — Excel, Word, Outlook & PowerPoint add-ins + Office Tab Pro
- One installer, one license — set up in minutes (MSI-ready)
- Works better together — streamlined productivity across Office apps
- 30-day full-featured trial — no registration, no credit card
- Best value — save vs buying individual add-in