Creating an actual vs budget chart in Excel (Step-by-Step Guide)
In Excel, creating an Actual vs Budget chart is a great way to visualize how well projects or tasks meet their target values. For example, you can represent target values as either bars or lines in the chart, as shown in the images below. This tutorial will guide you through creating these charts step by step, using Excel’s built-in features or the advanced charting tools in Kutools for Excel, to efficiently customize and tailor your charts to your specific data.
|
|

Create actual vs budget chart in Excel with 6 steps
Create actual vs budget chart in Excel with 3 steps by using a powerful Charts tool
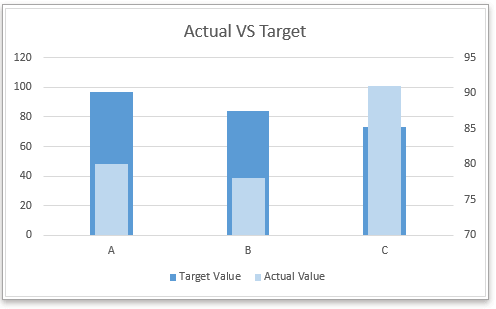
Creating an Actual vs Budget chart with target values as bars
1. Select the data range, and click Insert > Insert Column or Bar Chart > Clustered Column. See screenshot:
2. In the inserted chart, right click at the Actual Value series,then in the context menu, click Format Data Series.
Tip: If the Target Value series is the second series in the chart, you need to right-click on the Target Value series in this step.
3. In popping Format Data Series pane (in Excel 2010 or prior versions, there is popping a dialog box) check Secondary Axis option, then adjust the percentage in Gap Width until the Actual Value Series looks thinner than the Target Value series.
Now an actual vs budget chart is created.
Optional steps:
4. Remove the secondary y axis.
5. Change the series fill color as you need. Right click at the Actual series, select Format Data Series in the context menu. In the Format Data Series pane, under Fill & Line tab, check Solid fill option, and change filled color in Color drop-down list. See screenshot:
6. Change the title as you need.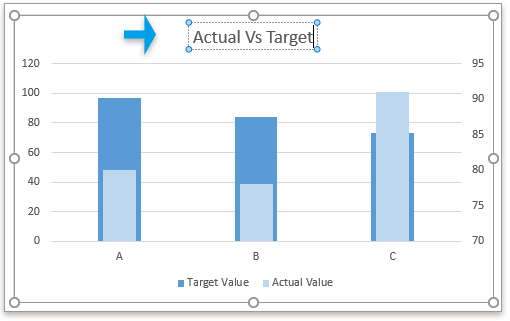
Creating an Actual vs Budget chart with target values as lines
1. Select the data range, and click Insert > Insert Column or Bar Chart > Clustered Column. See screenshot:
2. In the inserted chart, right click at the Target Value series, and click Change Series Chart Type in the context menu.
3. In popping Change Chart Type dialog, click the drop-down list next to Target Value in the Choose the chart type and axis for your data series section, select Line with Markers chart and then click OK. See screenshot.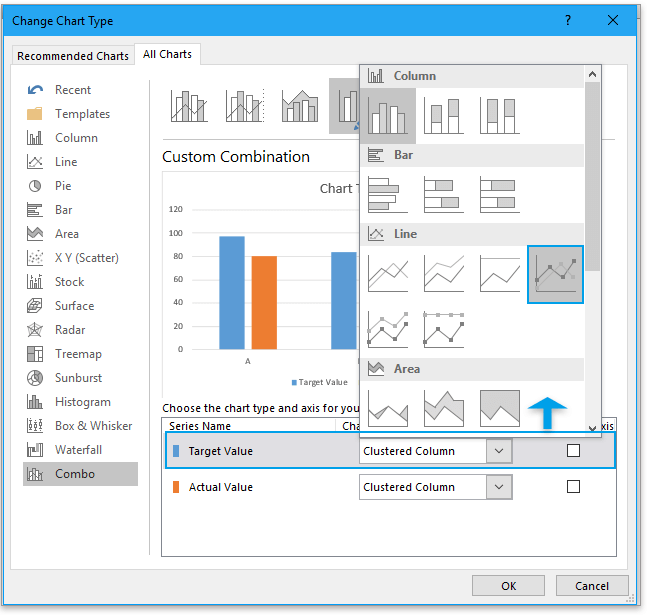
4. Right click at the Line with Markers chart, select Format Data Series from the context menu.
5. In the Format Data Series pane, under Fill & Line tab, go to the Line section, and check No line option in the Line options group.
6. Go to the Marker section, under Marker Options group, check Built-in option, choose the line type from the drop-down list of Type, then change the Size as you need.
Now the target values as lines chart has been created.
Additionally, you can change the fill color of the series and update the chart title as needed.
Tip: If you want to use the actual vs budget chart next time, you can save this chart to the Auto Text tool of Kutools for Excel which can collect charts and allow you to reuse them in anywhere anytime. All you need to do is update the chart references to match your specific requirements. Click to free download Kutools for Excel now. |

If you have Kutools for Excel installed, you can apply the Target and Actual Chart tool from the Charts group to quickly solve this job with 3 clicks.
1. Click Kutools > Charts > Progress > Target and Actual Chart.
2. In the Actual vs Target Chart dialog, select one chart type you want to create in the Chart Type section, then select x labels, target values and actual values as you need.
3. Click Ok, then a target vs actual chart has been created.

Tip:
1. If this is your first time using the tool, click the Sample button to see how it works.
2. You can change the chart color in the Format tab in Excel.
Kutools for Excel - Supercharge Excel with over 300 essential tools, making your work faster and easier, and take advantage of AI features for smarter data processing and productivity. Get It Now
Sample File
Create a bell curve chart template in Excel
Bell curve chart, named as normal probability distributions in Statistics, is usually made to show the probable events, and the top of the bell curve indicates the most probable event. In this article, I will guide you to create a bell curve chart with your own data.
Break chart axis in Excel
When there are extraordinary big or small series/points in source data, the small series/points will not be precise enough in the chart. In these cases, some users may want to break the axis, and make both small series and big series precise simultaneously.
Move chart X axis below negative values/zero/bottom in Excel
When negative data existing in source data, the chart X axis stays in the middle of chart. For good looking, some users may want to move the X axis below negative labels, below zero, or to the bottom in the chart in Excel.
Create a bubble chart in Excel
In Excel, a Bubble chart is a variation of a Scatter chart and its data is pointed as bubble. And if your each series has three data as shown as below, creating a Bubble chart will be a good choice to show the data series vividly.
Create bubble chart with multiple series in Excel
This tutorial will tell you how to create a bubble chart with multiple series in Excel step by step.
Best Office Productivity Tools
Supercharge Your Excel Skills with Kutools for Excel, and Experience Efficiency Like Never Before. Kutools for Excel Offers Over 300 Advanced Features to Boost Productivity and Save Time. Click Here to Get The Feature You Need The Most...
Office Tab Brings Tabbed interface to Office, and Make Your Work Much Easier
- Enable tabbed editing and reading in Word, Excel, PowerPoint, Publisher, Access, Visio and Project.
- Open and create multiple documents in new tabs of the same window, rather than in new windows.
- Increases your productivity by 50%, and reduces hundreds of mouse clicks for you every day!
All Kutools add-ins. One installer
Kutools for Office suite bundles add-ins for Excel, Word, Outlook & PowerPoint plus Office Tab Pro, which is ideal for teams working across Office apps.
- All-in-one suite — Excel, Word, Outlook & PowerPoint add-ins + Office Tab Pro
- One installer, one license — set up in minutes (MSI-ready)
- Works better together — streamlined productivity across Office apps
- 30-day full-featured trial — no registration, no credit card
- Best value — save vs buying individual add-in